
Figures & data
Figure 1. Site map showing the location of water track study areas (AOIs), the spatial footprint of the AOIs (blue rectangles), the location of MCM-LTER meteorological stations used for ground temperature comparison (green dots), and the location of the active layer monitoring station used to determine water track hydroperiod at one site (purple dot). Base map is the Landsat Image Mosaic of Antarctica (Bindschadler et al. Citation2008). Inset shows the location of the McMurdo Dry Valley study area in the red box.
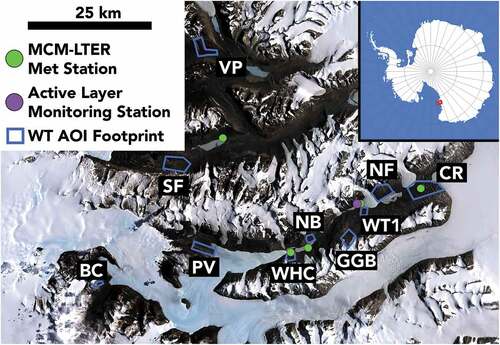
Figure 2. Example of the terrain correction process at the Coral Ridge site. The color image (RGB image, left) contains both wetted soils (blue arrows) and shadowed dark pixels (red arrows). Using the time-of-collection hillshade (center panel), it is possible to remove the contribution to surface reflectance from illumination falling on rough surfaces and darkening caused by shadows to produce a “flattened” terrain-corrected image (right), where dark pixels are dominantly caused by wetting of soils. Bright pixels may be snow and/or bright surface materials such as salt.
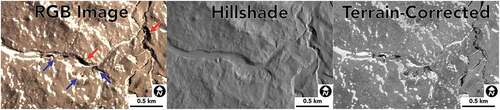
Figure 3. Example of classification of water track or wetland activity. At left, in the terrain-corrected image, dark linear features are interpreted as water tracks. In the center panel, darkened pixels may be water tracks and/or ponded soil moisture wetlands; however, because the image could not be terrain corrected, it is considered “unconfirmed.” At right, no water tracks are present in the terrain-corrected image.
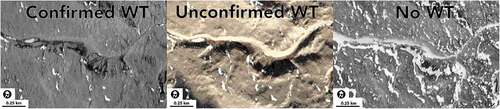
Table 1. Summary of water track temperature and soil moisture measurements at the water track active layer monitoring station.
Figure 4. Soil moisture measurements at the water track active layer monitoring station. Volumetric water content (VWC) is low and uniform in October but begins to rise at the near-surface (10 cm depth) sensor shortly after 1 November. In each measurement year, soil moisture increases in the water track from the surface downwards as thawing and flow begin, reaching saturated values at 30 to 40 cm depth. Freezing occurs more than 100 days after the start of thaw and at temperatures below 0°C.
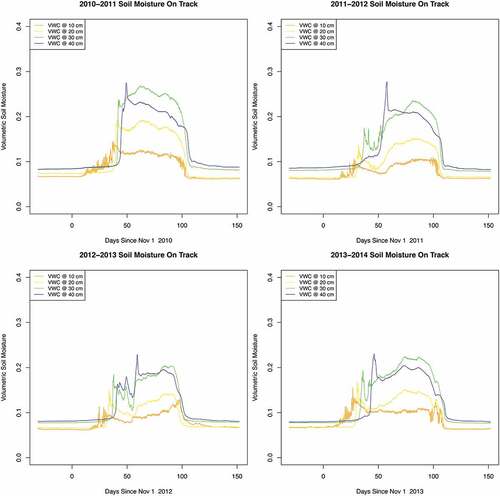
Figure 5. Summary of water track darkening activity determined using Planet image data. Water track–related darkening could be detected in terrain-corrected images at six of the ten study sites. Unconfirmed activity (images for which terrain correction was not fully successful) extend the hydroperiod from late November to mid-December and from late February to mid-March, suggesting the persistence of soil moisture at the surface of water tracks for up to 127.6 days. Map from (bottom) provided for spatial context.
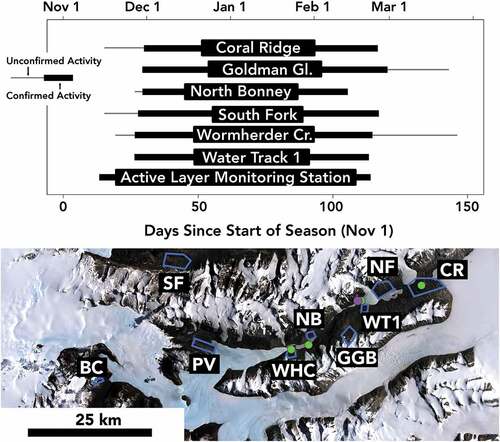
Figure 6. Terrain correction at the North Fryxell (Huey Creek) site. Although surface darkening from water tracks, hyporheic flow, or seepage along breaks in slope near the lake surface are suggested in color imagery, terrain correction reveals that all of this darkening results from shadowing and differential illumination. Although stream flow does occur at this site seasonally (Runkel, McKnight, and Andrews Citation1998), no water track–related surface darkening was identified at this site in 2018–2019. All apparent darkening is due to roughness and shadowing. Imagery © Planet 2019. All rights reserved.
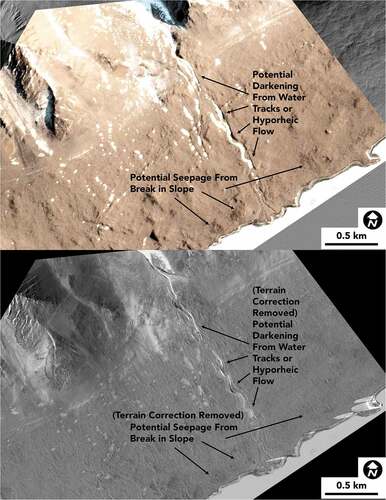
Figure 7. Water track activity at Coral Ridge determined via Planet image analysis. Vertical lines mark the time of Planet image collection. Vertical purple lines indicate confirmed water track observations in that particular image. Black vertical lines indicate no water tracks observed in that image. Confirmed water track activity begins as temperatures at 10 cm depth cross 0°C. Temperature data are from the nearby Explorer’s Cove MCM-LTER soil temperature station.
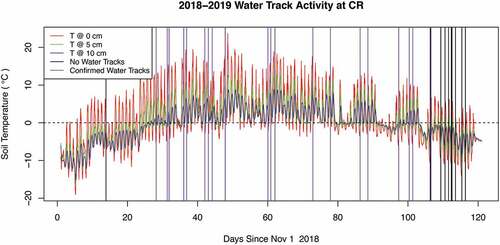
Figure 8. Water track activity at Water Track 1 determined via Planet image analysis. Vertical lines mark the time of Planet image collection. Vertical purple lines indicate confirmed water track observations in that particular image. Pink vertical lines indicate unconfirmed water track detections in that image. Black vertical lines indicate no water tracks observed in that image. Confirmed water track darkening postdates thaw at 0 and 10 cm depth by several days, whereas unconfirmed water track activity precedes subsurface thaw. Temperature data are from the nearby Lake Hoare MCM-LTER soil temperature station.
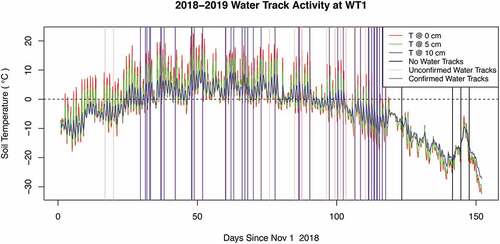
Figure 9. Water track activity at Goldman Glacier Basin determined via Planet image analysis. Vertical lines mark the time of Planet image collection. Vertical purple lines indicate confirmed water track observations in that particular image. Pink vertical lines indicate unconfirmed water track detections in that image. Black vertical lines indicate no water tracks observed in that image. Confirmed water track darkening occurs latest at this site of all analyzed sites. Unconfirmed water track darkening occurs in mid-November and persists into March. Temperature data are from the nearby Lake Hoare MCM-LTER soil temperature station.
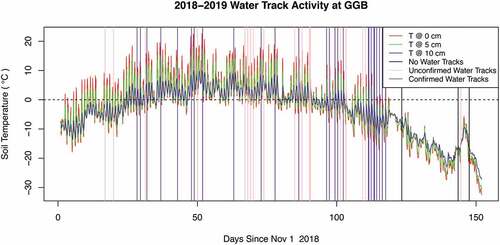
Figure 10. Water track activity at North Bonney determined via Planet image analysis. Vertical lines mark the time of Planet image collection. Vertical purple lines indicate confirmed water track observations in that particular image. Pink vertical lines indicate unconfirmed water track detections in that image. Black vertical lines indicate no water tracks observed in that image. Note that data are not available from the Lake Bonney MCM-LTER AWS station for part of 2018–2019. Confirmed darkening at North Bonney is not observed until much later in the season than at other water track sites. Temperature data are from the nearby Lake Bonney MCM-LTER soil temperature station.
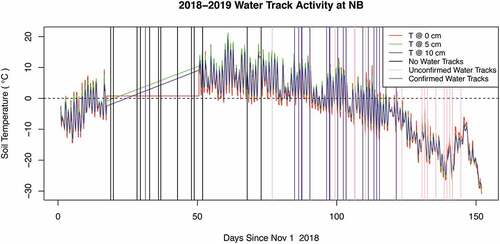
Figure 11. Water track activity at Wormherder Creek determined via Planet image analysis. Vertical lines mark the time of Planet image collection. Vertical purple lines indicate confirmed water track observations in that particular image. Pink vertical lines indicate unconfirmed water track detections in that image. Black vertical lines indicate no water tracks observed in that image. Subsurface temperatures were interpolated across the 2018–2019 data gap but are broadly consistent with confirmed water track darkening occurring as subsurface temperatures approach thawing temperatures. Temperature data are from the nearby Lake Bonney MCM-LTER soil temperature station.
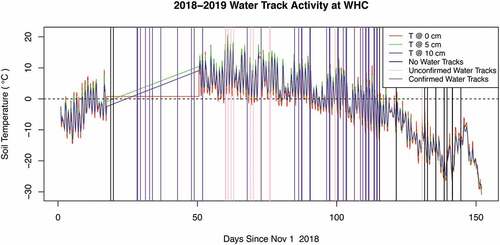
Figure 12. Water track activity at South Fork determined via Planet image analysis. Vertical lines mark the time of Planet image collection. Vertical purple lines indicate confirmed water track observations in that particular image. Pink vertical lines indicate unconfirmed water track detections in that image. Black vertical lines indicate no water tracks observed in that image. Unconfirmed water track darkening is present in the first image available in spring of 2018, but confirmed images are logged only when the darkened features merge into a linear feature at this site. Temperature data are from the nearby Lake Vanda MCM-LTER soil temperature station.
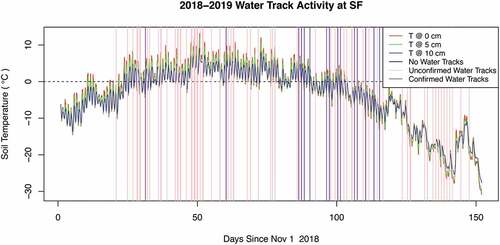
Figure 13. Summary of water track activity across all sites and all years (2010–2017) for all available WorldView images, plotted against maximum, minimum, and mean surface temperature at the nearest MCM-LTER meteorological station to the study site. Vertical lines mark the time of WorldView image collection. Vertical purple lines indicate confirmed water track observations in that particular image. Pink vertical lines indicate unconfirmed water track detections in that image. Black vertical lines indicate no water tracks observed in that image. Across all years and most sites, confirmed and unconfirmed observations of water track darkening typically slightly precede the onset of thaw (T > 0°C) at the surface. Sites further from the coast or south-facing sites (e.g., North Bonney, North Fryxell, and Wormherder Creek) commonly show delayed onset of water track darkening. Black lines (WT not detected) could be due to cloud cover in the image, poor lighting geometry, or lack of the presence of water tracks.
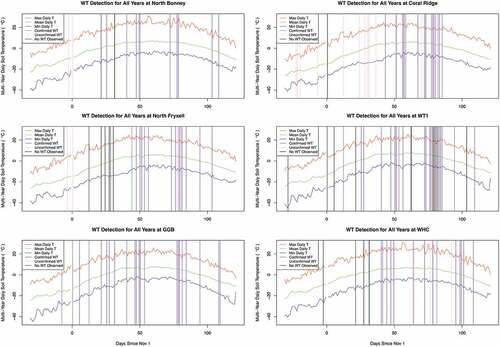
Figure 14. Water tracks at their full spatial extent and maximum darkening. Water track and wetland soils are dark, digitated, and oriented in broad depressions. All images are terrain-corrected PlanetScope images overlaying time of collection hillshades. Imagery © Planet 2019. All rights reserved.
Figure 15. Water track and wetland soil within the Goldman Glacier Basin site. WorldView images show darkening in the right side of the image early in the season (by 4 November), followed by growth of glacier runoff on the left side of the image later in the month. Water track darkening persists and grows, even as glacier melt and runoff shuts down on 26 November 2010 as snow blankets the glaciated region of the image. Images © 2010 Maxar.
Figure 16. Water track and wetland evolution at the Coral Ridge AOI. PlanetScope images show the evolution of the site from no water tracks (13 November 2018) through water track growth and expansion. Snow is largely absent from water track alcoves by 6 December, yet water tracks continue to expand, suggesting that ground ice at this site contributes meltwater to water track and wetland soils. Imagery © Planet 2019. All rights reserved.
Supplemental Material
Download Zip (115.2 MB)Data availability statement
Weather station data used in this study are available for download from the MCM-LTER at mcmlter.org. Active layer temperature and soil moisture data used in this station are archived at the U.S. Antarctic Program Data Center and can be accessed at https://www.usap-dc.org/view/dataset/600139. Planet data were made available to this project under the Planet Federal Contract. WorldView data were provided via the Polar Geospatial Center.