Figures & data
Figure 1. (a) Schematic map of the northern North Atlantic showing the location of the Fram Strait. The red arrow represents the path of the warm Atlantic Water: Norwegian Atlantic Current (NwAC), WSC. A black square indicates core GeoB 17603-3, used for the construction of the age model. (b) Western Spitsbergen Margin showing the main oceanographic currents. The red arrow represents the path of the warm AW, the blue arrows represent the cold and fresher East Spitsbergen Current and the Spitsbergen Polar Current. The green arrows indicate the continental freshwater (FW) input from the fjords to marine domains. Yellow diamond indicates the studied core GS191-01PC (01-PC in the figure). The full gray dots indicate other core sites discussed in the article: (1) core HH12-1206BC (Zamelczyk et al. Citation2020), (2) core MSM5/5-712 (Werner et al. Citation2011; Müller et al. Citation2012; Cabedo-Sanz and Belt Citation2016; Matul et al. Citation2018), and (3) core NP05-21 (Jernas et al. Citation2013). The gray dotted line A–A′ indicates the hydrographic section. (c) Hydrographic section along the Western Spitsbergen Margin that shows the variation of temperature and salinity. Oceanographic data from H. E. Garcia et al. (Citation2019).
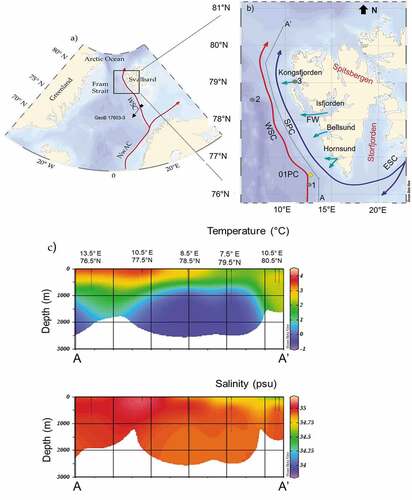
Figure 2. Core correlation stratigraphy. The red arrows indicate the 14C ages, and the gray dashed lines indicate correlation between the tie points, lowfield magnetic susceptibility (k), and anhysteretic remanent magnetization (ARM) (modified from Caricchi et al. Citation2018, Citation2019).
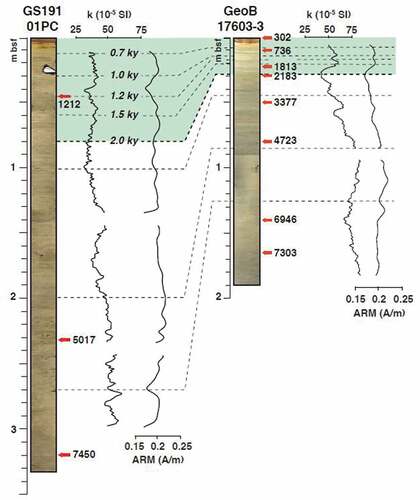
Table 1. Environmental meaning of the proxies used in this work.
Figure 3. Photo and X-ray of the studied core GS191-01PC together with XRF ratios: Zr/Rb, Ca/Ti, Si/Al, Si/Ti, and K/Ti and clay mineral content against core depth. The age model is also reported. The yellow shades correspond to warm intervals and the gray shades correspond to cold intervals, as noted in the discussions. sm = smectite; kln = kaolinite; chl = chlorite; ill = illite.
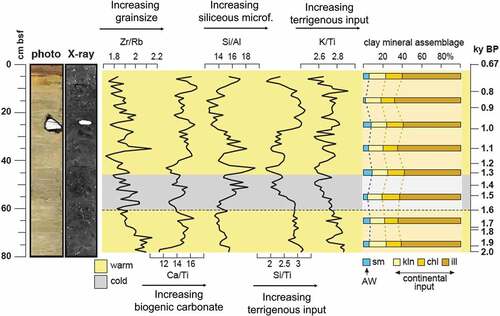
Figure 4. Absolute diatom abundance and down-core distribution of diatom species are expressed as relative abundance plots against the depth. The age model is also reported. The yellow shades correspond to warm intervals and the gray shades correspond to cold intervals. The white shade indicates a level barren in diatoms.
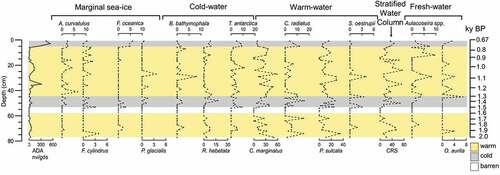
Figure 5. Down-core distribution of calcareous nannofossil species expressed as a percentage, total abundance, and H/P index plots against the depth. The age model is also reported. The yellow shades correspond to warm intervals and the gray shades correspond to cold intervals. The dotted line indicates the change in paleoenvironment at 1,500 years BP. ArW = Arctic Water. AW = Atlantic Water.
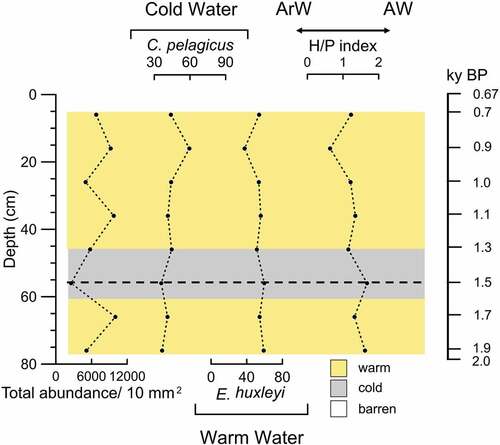
Figure 6. Down-core distribution of absolute planktic and benthic foraminifera abundance expressed as number of tests on grams of dry sediment and foraminifera species expressed as percentage plots against the depth. The age model is also reported. The yellow shades correspond to warm intervals and the gray shades correspond to cold intervals.
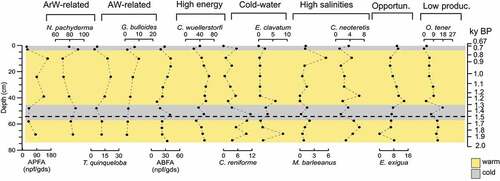
Figure 7. Age–depth plot for the studied sediments interval. The main climatic and paleoenvironmental events are illustrated, supported by sedimentological and micropaleontological evidence. The black line indicates the main climatic period recognized in the studied sedimentary sequence, the dotted lines limit the minor climatic event, black arrows indicate the increasing or decreasing of a proxy.
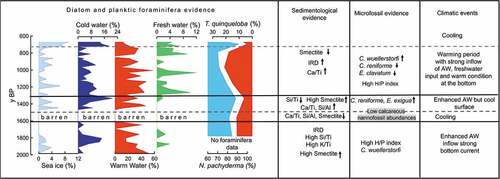
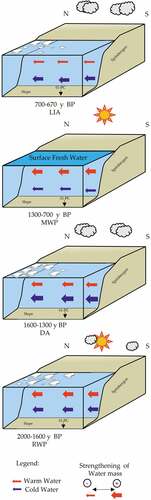
Figure 8. Sketch illustrating the oceanographic variations along the continental shelf margin of west Spitsbergen during the last 2,000 years BP.