
Figures & data
Figure 1. An American pika (Ochotona princeps) in the Rocky Mountains. Photograph courtesy of Kristi Odom.
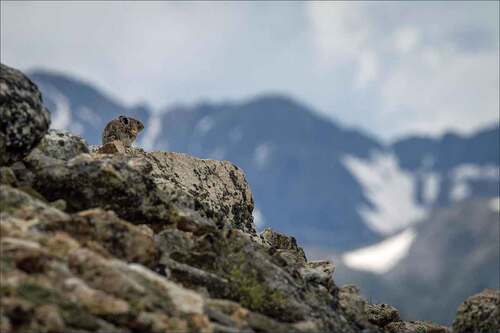
Figure 2. Study site locations within Rocky Mountain National Park (Larimer County) and adjacent to Niwot Ridge (Boulder County), Colorado, USA. Blue triangles = active rock glaciers, red triangles = fossil rock glaciers. Black boundary delimits the southeastern portion of Rocky Mountain National Park.
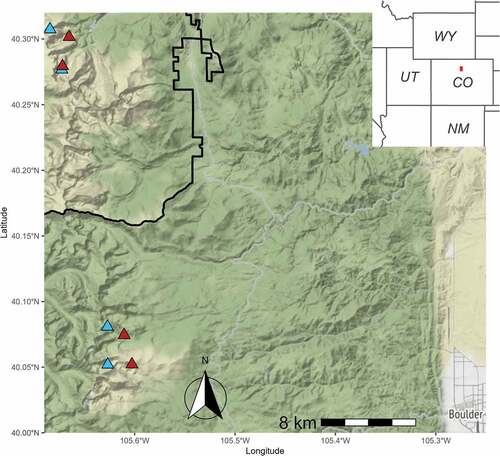
Table 1. Paired active (A) and fossil (F) rock glaciers studied in Rocky Mountain National Park (ROMO) and adjacent to the Niwot Ridge long-term ecological research site (NWT), Boulder County, Colorado, USA.
Table 2. Fixed effects and associated hypotheses used to construct three sets of linear mixed-effects models of glucocorticoid metabolite concentrations measured from fecal sampling in individual territories of the American pika.
Figure 3. Elevation range of sampled territories grouped by site (n = 8). Abbreviated site names distinguish active (“A”) from fossil (“F”) rock glacier sites ().
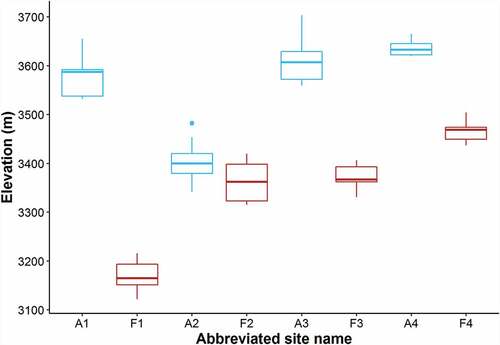
Figure 4. Pika fecal glucocorticoid metabolite (FGM) concentration, log-scaled by sex and season. (a) In the spring, eighteen samples were classified as female (pink circles) and thirty-six were classified as male (blue circles); the remaining forty samples were classified as unknown due to DNA amplification failure (black circles) or insufficient size (black triangles). (b) In the fall, fifteen samples were classified as female, fifty as male, and the remaining twenty-five as unknown.
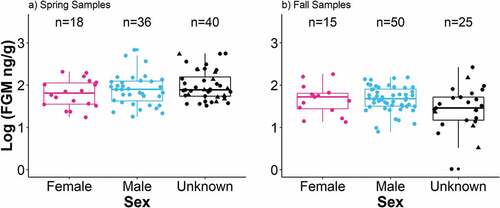
Figure 5. Fecal glucocorticoid metabolite (FGM) concentration by elevation and season. Each point represents a unique fecal sample colored by the season in which it was collected (green = spring, orange = fall). Lines show mean FGM concentration by season with 95 percent confidence intervals.
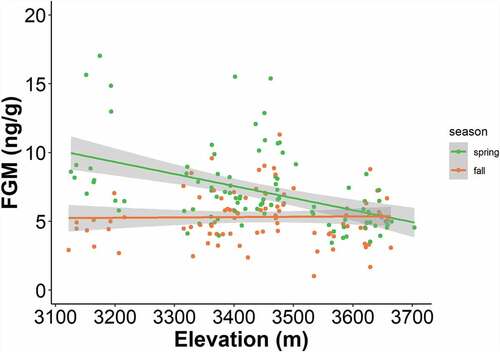
Figure 6. Fecal glucocorticoid metabolite (FGM) concentration by percentage graminoid cover (left) or graminoid-to-forb ratio (right) colored by rock glacier status (blue = active, red = fossil). Lines show mean FGM concentration with 95 percent confidence intervals.
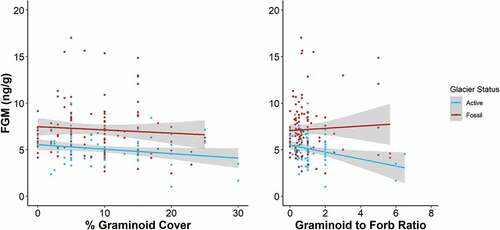
Figure 7. Fecal glucocorticoid metabolite (FGM) concentration for all sampled territories grouped by rock glacier status and season. When available, fecal samples were collected from each territory in the spring and in the fall of 2018 from locations along the Front Range of Colorado. These box-and-whisker plots depict median (heavy horizontal line), interquartile range (box), range (whiskers), and outliers (dots).
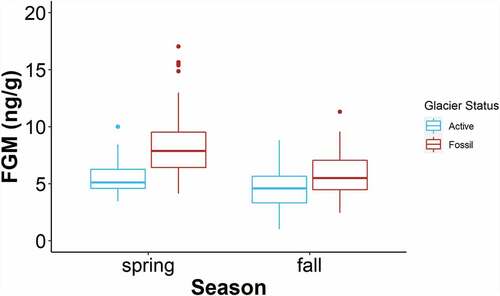
Table 3. Relative support for models of fecal glucocorticoid metabolite (FGM) concentration (log-FGM) in pika territories sampled within Rocky Mountain National Park and adjacent to the Niwot Ridge long-term ecological research site (n = 184).
Figure 8. Subsurface temperature metrics grouped by rock glacier status (blue = active, red = fossil). Metrics were estimated from one subsurface temperature logger placed in the center of each rock glacier site. Standard box-and-whisker plots depict median (heavy horizontal line), interquartile range (box), range (whiskers), and outliers (dots). P-values are reported for each Student’s t-test comparing means of subsurface temperature metrics between rock glacier status. Using Bonferroni correction, significance is determined by an alpha level of .00625.
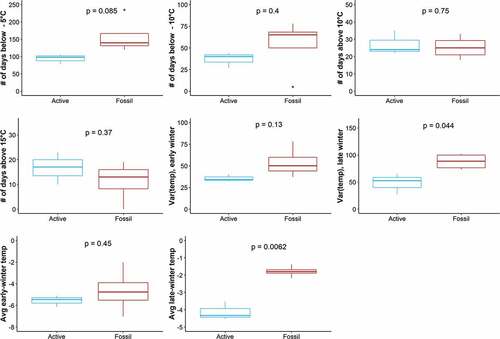
Table 4. Relative support for models of fecal glucocorticoid metabolite (FGM) concentration (log-FGM) from an exploratory comparison of all model sets () using data from all samples with corresponding subsurface temperature data (n =170).
Supplemental Material
Download Zip (19.9 KB)Data availability statement
The data that support the findings of this study are openly available in the Environmental Data Initiative repository at https://doi.org/10.6073/pasta/929e2f61cb0926cf58ebac09d187148f, and https://doi.org/10.6073/pasta/b15009b35926522f75e43e1e9a861d64.