Figures & data
Figure 1. The study site and other glaciers mentioned in the study: Austre Brøggerbreen and Midtre Lovénbreen (1); Waldemarbreen and Irenebreen (2), Svenbreen (3); Werenskioldbreen (4); and the push moraine of Vestre Grønfjordbreen (5).
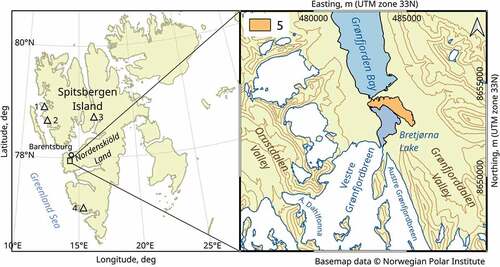
Table 1. Annual and seasonal glaciological mass balances of Vestre Grønfjordbreen in 2013/14–2019/2020.
Figure 2. (a) Observational network on Vestre Grønfjordbreen and (b) the profiles of the ground-based GNSS survey (2019): snow thickness sampling sites (1); snow pits (2); ablation stakes (3); GNSS survey profiles (4); and elevation contour lines for year 2015 (5).
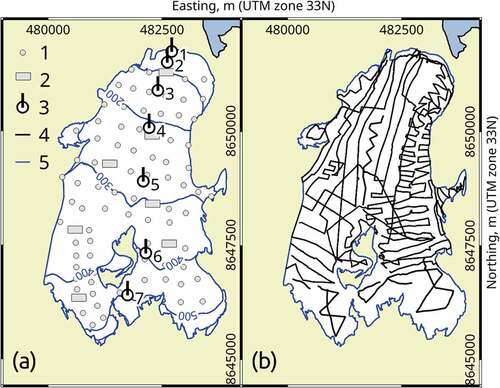
Figure 3. The results of the GPR study of Vestre Grønfjordbreen. (a) Ice thickness in April 2019: outlines of temperate ice (1); outlines of firn zone (2). (b) Bed elevations based on the GPR survey: outlines of temperate ice (1); minor ice fall (2). (c) Profiles of the GPR study: year 2019 (1); year 2010 (2); the deepest observed glacier ice (3). (d) The intersection of processed GPR lines (OpendTect 6.4 software was used for visualization).
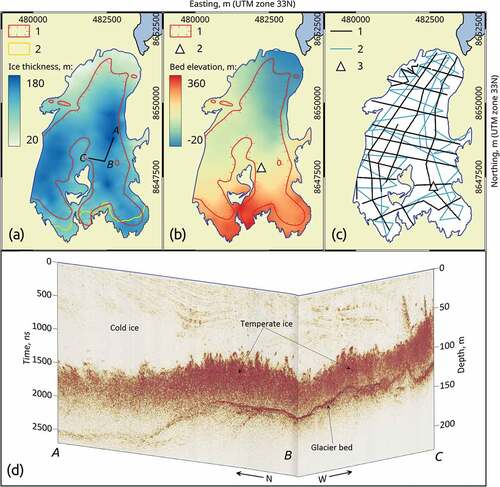
Table 2. Cumulative mass losses of Vestre Grønfjordbreen computed by two methods.
Figure 4. (a) Surface lowering in 2015–19: contour lines of surface lowering (1), 5 m interval; supposed main flow lines (2). (b) Annual flow velocities between 2018 and 2019: contour lines of bed inclination, 5° interval (1); stake velocities and directions (2).
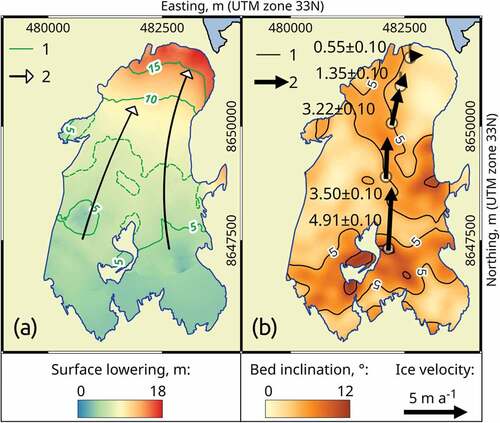
Figure 5. Pit-averaged snow density values for Vestre Grønfjordbreen in 2014–2020.
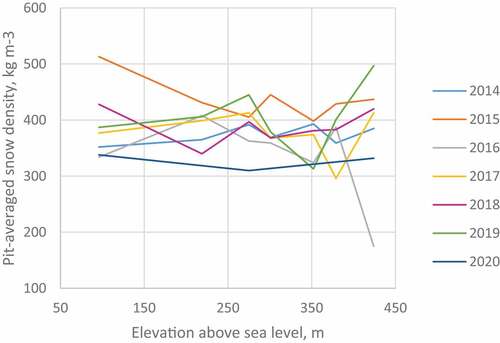
Figure 6. Area-altitude distribution for Vestre Grønfjordbreen (averaged between 2015 and 2019) and mass-balance profiles measured by glaciological method.
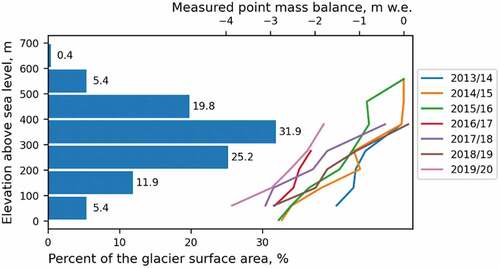
Table 3. Comparison between GPR results for the years 2010 and 2019.
Figure 7. (a) Cumulative mass loss of Vestre Grønfjordbreen and (b) total glacier mass (b) for the period 2013/14–2019/20.
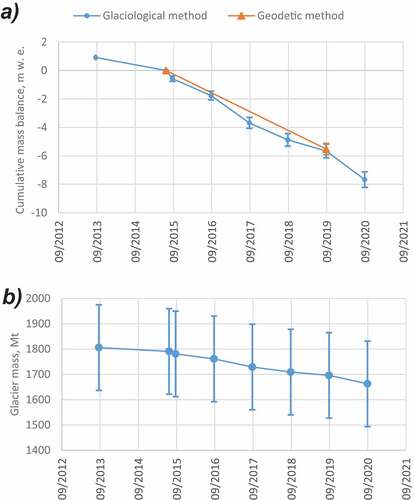
Figure 8. Scatterplots between mass-balance values of Vestre Grønfjordbreen and meteorological parameters at the Barentsburg weather station: (a) annual mass balances and positive degree-day sums; (b) summer mass balances and positive degree-day sums; (c) winter mass balance and precipitation amounts during October–April; (d) annual mass balances and winter mass balances.
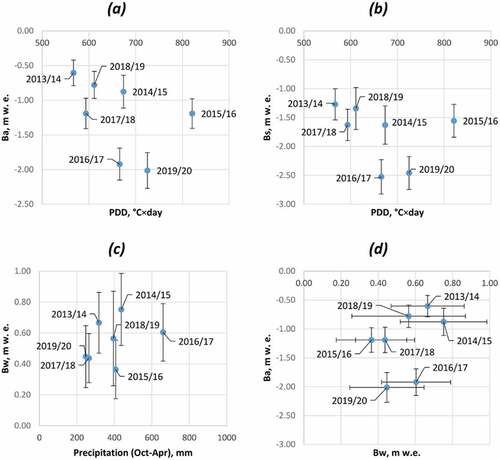
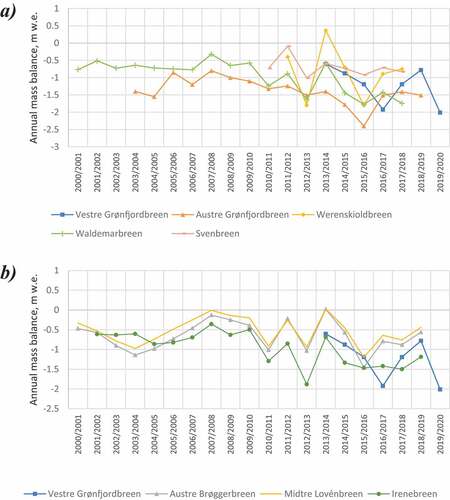
Table 4. Matrix of pair correlation coefficients for annual mass balances of land-terminating Svalbard glaciers: a) for the period of 2013/14–2018/19, b) for the maximum available overlapping monitoring period; total length of observational series (in mass-balance years) is indicated for each glacier in parentheses.
Figure 9. Interannual variability of land-terminating Svalbard glaciers: (a) poorly correlated with Vestre Grønfjordbreen; (b) better correlated with Vestre Grønfjordbreen.