Figures & data
Figure 1. (a) Map of the study area in the Baltic Sea (Bathymetry Database v0.9.3 by Hell and Öiås Citation2014). The black rectangle indicates the location of the insert showing detailed location of Site M0063 in the Landsort Deep. The present surface water circulation (gray arrows) and deeper circulation (light gray arrows) are redrawn from Larsson et al. (Citation2017). (b) Pre-Quaternary geology of the Baltic Sea region (modified from Rosentau et al. Citation2017).
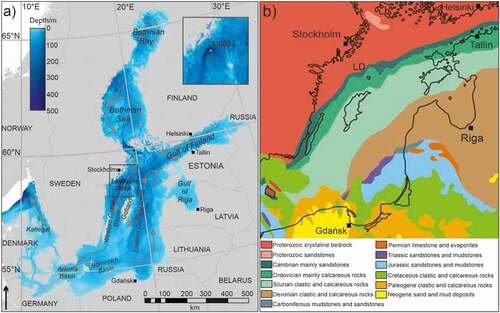
Figure 2. Evolution of the Baltic Ice Lake and decay of the Fennoscandian Ice Sheet at ~13.0 and 11.5 ka BP. Source: Kallio (Citation2006), by M. Saarnisto/Geological Survey of Finland. Black dot marks the location of the Landsort Deep, black triangle marks Mt. Billingen, and black arrow marks the Öresund strait. The contemporary continental rivers (blue lines) are redrawn from Patton et al. (Citation2017).
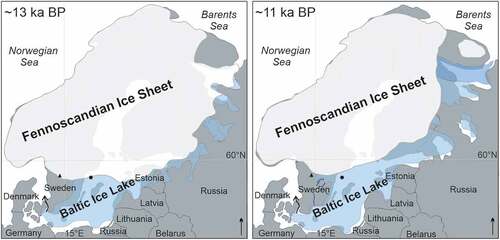
Figure 3. Core images representing the main lithologies of Units V and VI: (a) brownish/reddish sandy silt with slightly disturbed laminated structures (347-M0063C-38-2, 89–90.5 mbsf); (b) silt–clay with sandy interlaminaes and massive structures (347-M0063C-37-2, 85.7–87.2 mbsf; (c) clay and silt with coarser interlaminaes (347-M0063C-36-1, 80.9–82.4 mbsf); (d) interlaminated silt and clay, slightly disturbed, carbonate concretion (347-M0063C-33-2, 72.5–74 mbsf); (e) silty clay laminated by color and grain size (347-M0063C-30-2, 62.6–64.1 mbsf); (f) silty clay, homogeneous gray clay interbeds (347-M0063C-27-1, 52.6–54.1 mbsf); (g) dark gray/grayish brown silty clay, contorted silt laminaes, convolute bedding, slumping (347-M0063C-25-2, 48.6–50 mbsf); (h) dark gray clay (347-M0063C-24-2, 47.4–48.6 mbsf). Images downloaded from the Pangaea data portal (Expedition 347 Scientists Citation2014b).
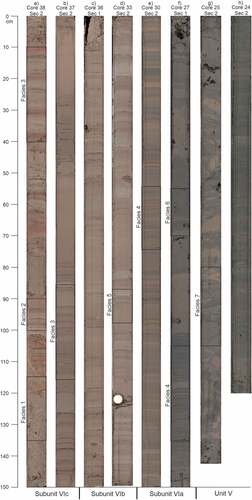
Figure 4. Representative images of sedimentary lithofacies from Units V and VI: (a) disorganized sandy–silty clay (diamict), interval 347-M0063C-38-2, 115 to 135 cm; (b) laminated fine sand and silt (Facies 2), sandy planar laminae indicated with black thin arrows, interval 347-M0063C-38-2, 90 to 100 cm; (c) sandy silt/clay couplets (Facies 3) with thickness of 30 to 60 mm, boundaries indicated with black arrows, interval 347-M0063C-38-2, 10 to 40 cm; (d) sandy silt–clay couplets (Facies 3) with thickness of 10 to 30 mm, boundaries indicated with black arrows, interval 347-M0063C-37-2, 85 to 115 cm; (e) silt–clay couplets (Facies 4) with thickness of 20 to 30 mm, light colored silty portions are laminated, boundaries indicated with black arrows, interval 347-M0063C-30-2, 55 to 75 cm; (f) silt–clay couplets (Facies 4) with thickness of 5 to 20 mm, couplet boundaries (indicated with black arrows) can be diffuse and darker colored clay portions become thicker and massive, interval 347-M0063C-27-1, 105 to 135 cm; (g) laminated to massive silty clay (Facies 5), silty laminae indicated with black thin arrows, interval 347-M0063C-33-2, 87 to 97 cm; (h) faintly laminated clay (Facies 6), interval 347-M0063C-27-1, 55 to 70 cm; (i) deformed clay to silt–clay (Facies 7), microscale transverse fault indicated with black thin arrow, interval 347-M0063C-25-2, 80 to 105 cm. Images downloaded from the Pangaea data portal (Expedition 347 Scientists Citation2014b).
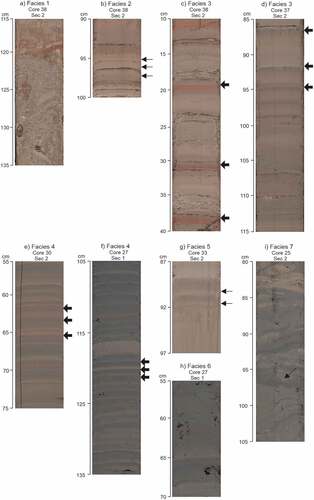
Table 1. Summary of the sedimentary lithofacies types used for the Landsort Deep sediments.
Figure 5. Sand, silt, and clay content (vol%) of the studied samples from various depths from Units V and VI. Grain size of <2 µm is classified as clay, 2 to 63 µm, is silt and >63 µm is sand. Gamma wet bulk density and magnetic susceptibility values data from the Pangaea data portal (Expedition 347 Scientists Citation2014b).
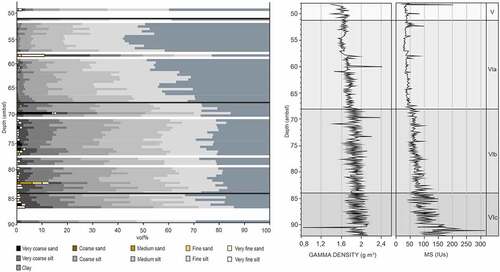
Figure 6. Clay mineral distribution and kaolinite–chlorite and quartz–feldspar ratios of the studied samples from Units V and VI.
Figure 7. Water and carbon content from Units V and VI. Data for total organic carbon (TOC), total inorganic carbon (TIC), and total carbon (TC) from the Pangaea data portal (Expedition 347 Scientists Citation2014b). LOI = Loss on ignition.
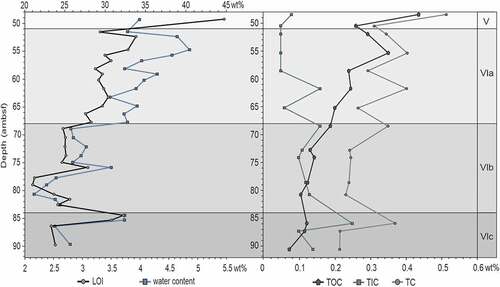
Figure 8. X-ray diffractogram of a clay fraction sample from the Landsort Deep sediments showing the principle of the major clay and non-clay mineral evaluation used in this study identified from three runs: normal, ethylene glycol treated, and heated (550°C).
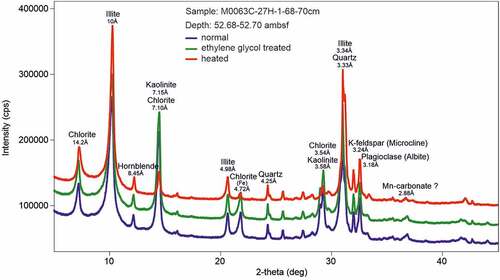
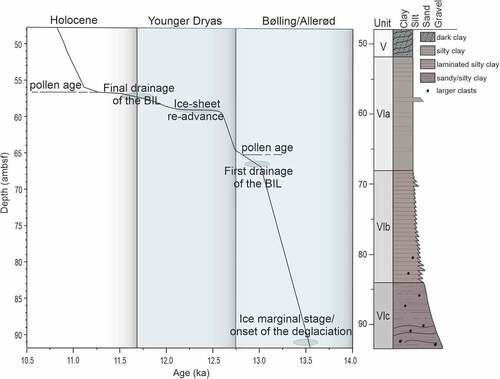
Figure 9. Inferred age–depth model of the sediment deposition of the Baltic Ice Lake stage based on the present multiproxy study from the Landsort Deep sediments from Units V and VI. The lenses illustrate the time span of the different stages of the Baltic Ice Lake presented in the figure. Pollen age distributions by Andrén et al. (Citation2015) are shown by dashed lines.