Figures & data
Figure 1. Location of the Central Southern Alps of New Zealand. BR = Barrier Range; BOR = Ben Ohau Range; LR = Liebig Range; TTR = Two Thumb Range; LH = Lake Heron; LC = Lake Coleridge; AP = Arthur’s Pass; MC = Mount Cook.
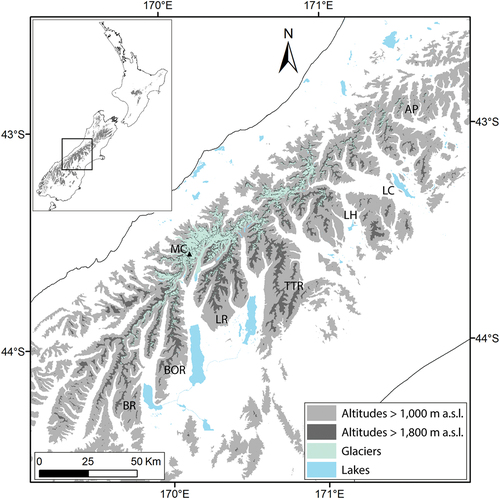
Figure 2. Footprints of the Sentinel-1 data used over the Southern Alps. Left: Ascending orbit number 23; Right: Descending orbit number 146.
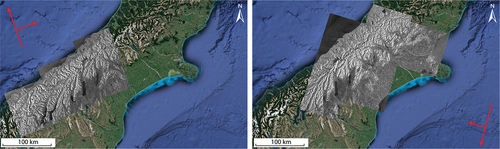
Figure 3. Examples of noisy interferograms. The color scale corresponds to a complete fringe equivalent to a change in topography of half the wavelength (2.8 cm for Sentinel-1). The black arrow indicates the LOS direction. Black patches correspond to layover and shadow areas. (a) Three hundred sixty-day ascending interferogram (13 March 2017–18 March 2018) and (b) corresponding orthoimage show noisy patterns in the steep slopes and around the crests, together with the absence of signals on the three indicated relict rock glaciers (white stars). Location: 43°51′12″ S/170°43′40″ E. (c) Twenty-four-day ascending interferogram, 31 March 2017–24 April 2017) and (d) (corresponding orthoimage) show a noisy pattern on a steep and regular east-facing valley side (white arrow). Location: 43°46′20″ S/170°21′20″ E. Basemap: Orthoimage 2006 (Terralink Citation2004–2010).
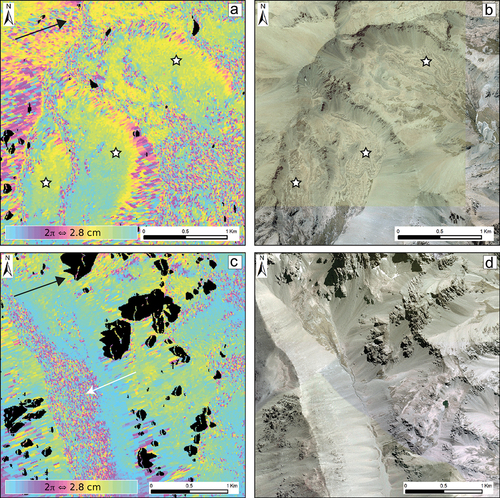
Table 1. Categories of kinematic attributes and related activity.
Figure 4. Number of active and transitional rock glaciers per aspect class.
Figure 5. (a) Oblique view on active rock glacier units on the head of Irishman Stream, Ben Ohau Range (Photo C. Lambiel, 2016.01.10; Location: 43°59ʹ17”S/170°03ʹ00”E); (b) annual horizontal velocities of rock glaciers RG_19 and RG_20-2 measured with dGNSS between 10 January 2016 and 8 February 2017 and moving areas mapped from InSAR data; (c) 24-day descending interferogram (26 March 2016–19 April 2016) with moving areas; (d) 360-day descending interferogram (12 February 2015–7 February 2016) with moving areas. Black arrows indicate LOS. Basemap: Orthoimage 2006 (Terralink Citation2004–2010).
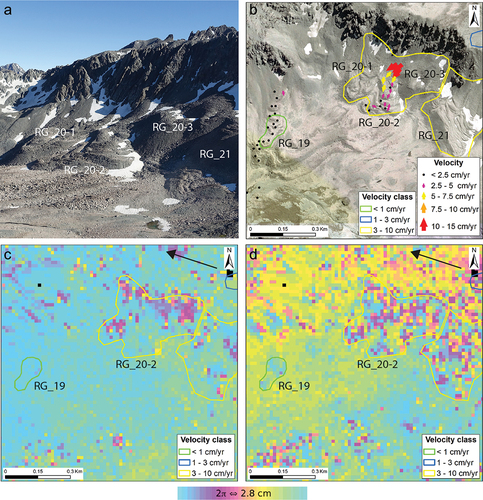
Figure 6. Example of an active rock glacier: (a) and (b) RG_111, Two Thumb Range (location: 43°35′00″ S/170°39′28″ E) and of two rock glaciers classified as transitional (c) and (d) RG_023 (west) and RG_024 (east), Ben Ohau Range (location: 43°59′04″ S/170°03′50″ E). (a) Twelve-day ascending interferogram (9 March 2019–21 March 2019) with moving area; (b) corresponding orthoimage with moving area and rock glacier outline; (c) forty-eight-day ascending interferogram (7 March 2017–24 April 2017) with moving areas; (d) corresponding orthoimage with moving areas and rock glacier outlines. Black arrows indicate LOS. Basemap: Orthoimage 2006 (Terralink Citation2004–2010).
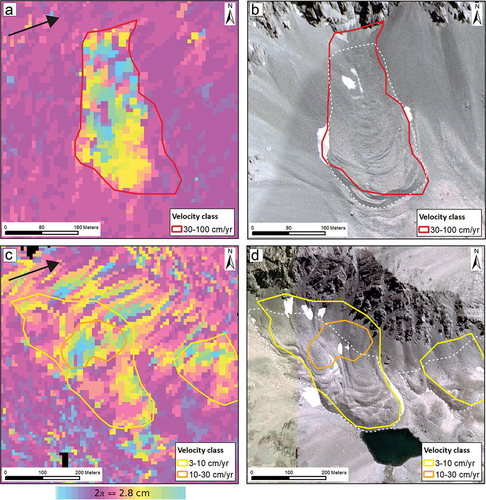
Figure 7. Location and kinematics of the active and transitional rock glaciers in the Central Southern Alps.
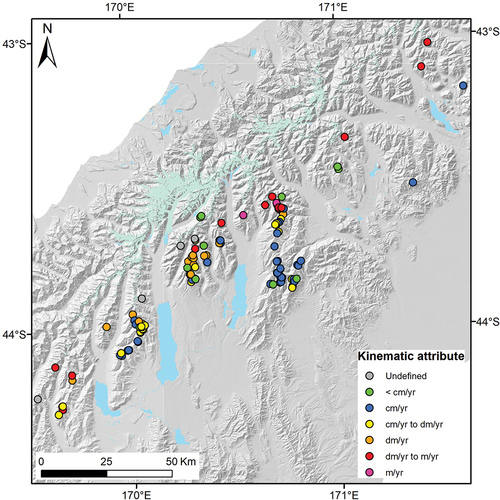
Figure 8. Two adjacent rock glacier units (RG_088_3, south, and RG_088_4, north; Two Thumb Range, 43°35′39″ S/170°44′05″ E). Left: Twelve-day ascending interferogram (9 March 2019–21 March 2019). Right: Corresponding orthoimage with rock glacier units’ outlines. RG_088_3 may be a debris-covered glacieret, as evidenced by the small lateral crests. Black arrow indicates LOS. Basemap: Orthoimage 2006 (Terralink Citation2004–2010).
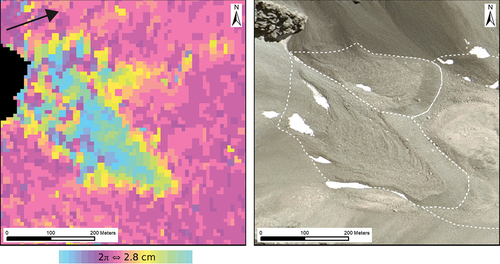
Figure 9. Altitudes of the front for transitional and active rock glaciers, as well as for “classical” active rock glaciers (i.e., after removing the possible/likely debris-covered glacierets and the glacitectonized frozen landforms) in the entire study area. The number of rock glaciers is indicated at the bottom of the chart.
Figure 10. Proportion of rock glaciers by kinematic class.
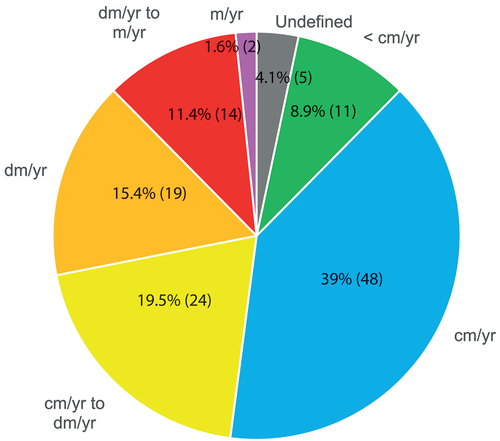
Figure 11. Link between rock glacier kinematics and altitude. The number of rock glaciers is indicated at the bottom of the chart.
Table 2. Comparison matrix of rock glacier categorization in the present study and that of Sattler et al. (Citation2016).
Figure 12. Distribution of the MAAT for the period 1981–2010 for active and transitional rock glaciers. Data source: NIWA.