Figures & data
Figure 1. Pictures of two related Rhododendron species, (a) R. diversipilosum and (b) R. subarcticum, growing at alpine fellfields in Hokkaido of northern Japan.
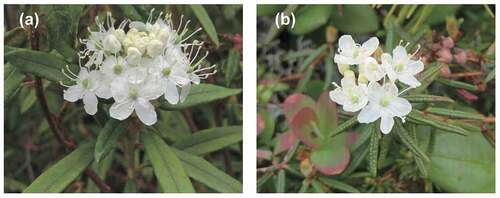
Figure 2. (a) Location of the Taisetsu Mountains in Hokkaido and (b) study sites of this study.
Table 1. Geographical locations of individual study sites and observation year.
Figure 3. (a) An example of belt transect setting. Five quadrates (white squares) were arranged from a marginal part of the Pinus pumila patch toward the exposed direction. (b) Relationship between the distance from P. pumila patches and the abundance of each species, expressed as a rank of plant cover at 10 percent accuracy. Black solid line indicates P. pumila, black broken line indicates Rhododendron diversipilosum, and grayish line indicates R. subarcticum. Vertical axes show the mean value of the coverage of each species. Error bars indicate standard error.
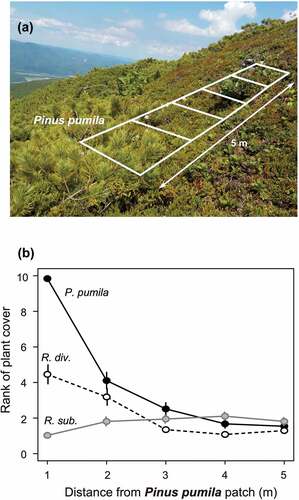
Figure 4. Comparisons of morphological and performance traits between Rhododendron diversipilosum and Rhododendron subarcticum at the fellfield habitat: (a) individual leaf area, (b) leaf mass per area (LMA), (c) leaf longevity, (d) annual leaf production in dry weight, (e) annual shoot elongation, (f) plant height, and (g) flower number per inflorescence. ***p < .001, n.s. = not significant.
Figure 5. Comparisons of flowering periods of Rhododendron diversipilosum and R. subarcticum in each study site. (a) Mt. Hira, (b) Mt. Muka, (c) Mt. Hisago, and (d) Mt. Tengu. The number of flowering inflorescences per plot (n = 6) was measured in early, middle, and late flowering seasons of two Rhododendron species. Open column: R. diversipilosum, gray column: R. subarcticum. Error bar indicates standard error.
Figure 6. Results of the hand-pollination experiment conducted in 2018 at the Mt. Hisago site for (a) Rhododendron diversipilosum and (b) R. subarcticum. Seed set percentage in each treatment (Co: control, Oc: outcross pollination, He: heterospecific pollination, Ba: simple bagging, Se: self-pollination) is shown. Sample size of each treatment is shown within parentheses. Different characters indicate significant difference in each species among treatments (p < .05 by Tukey’s test).
Figure 7. Germination progress after seed sowing under 25°C condition. Open circles connected with solid line indicate Rhododendron diversipilosum seeds, gray circles with solid line indicate R. subarcticum seeds, and black circles with dashed line indicate hybrid seeds. Mean values of four replicates with standard errors are shown.
Table 2. GLMM results of the seed germination experiment in each species (Rhododendron diversipilosum and Rhododendron subarcticum) under three thermal conditions: constantly high (25°C), constantly low (15°C), and fluctuation (25/10°C).
Table 3. Genetic characteristics of Rhodoendron diversipilosum and Rhodoendron subarcticum populations at each site.
Figure 8. The correlation between the geographic distance and pairwise Fst value in (a) Rhododendron diversipilosum and (b) R. subarcticum. No significant correlation was found by Mantel test in each species.