Figures & data
Figure 1. Photos from the LEO post on the sudden lake drainage event that happened on 29 June 2022 (Tessier et al. Citation2022). (a) Oblique aerial photo of the drained lake basin on 10 August 2022 (photo credit: Sebastian Zavoico). (b) Ground photo of the recently exposed drained lake basin floor and (c) the thermo-erosional drainage gully that formed during the drainage event (photo credits: Susan Tessier, 29 June 2022). (d) The thermo-erosional drainage gully fifty-four days after the lake drained showing continued permafrost thaw and ground ice melt since the drainage event (photo credit: Benjamin Jones).
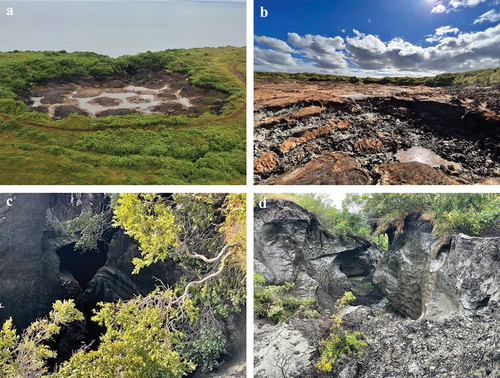
Figure 2. The northwestern Arctic region of Alaska where the thermokarst lake drained on 29 June 2022. (a) An inset map showing the location of the northern part of the Baldwin Peninsula (red box). (b) A Landsat satellite image showing the northern Baldwin Peninsula and the location of the drained thermokarst lake (yellow box). (c) A Worldview-2 satellite image from 20 July 2017 showing a series of small thermokarst lakes that have formed in ice-rich permafrost. Schaeffer Lake is the lake that drained on 29 June 2022. ©2023 Maxar.
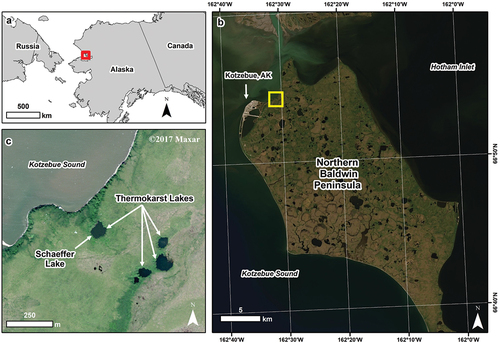
Figure 3. Very high-resolution satellite image time series bracketing the drainage of Schaeffer Lake to the time period observed by local environmental observers. The lake drained between 24 June 2022 (note smoke is present) and 30 June 2022 as observed in the 0.5 m resolution satellite images. The observation from 4 August 2021 was the last non-smoke and snow/ice-affected image available for the site prior to the lake drainage. The image acquired on 1 August 2022 demonstrates that the lake drainage was complete. ©2023 Maxar.
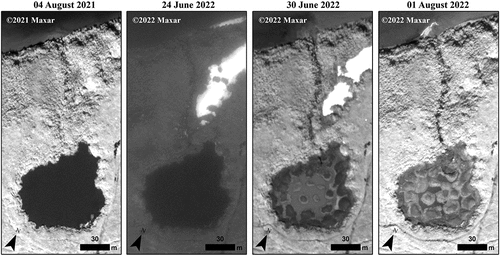
Table 1. Historic aerial photograph and contemporary satellite imagery used in our analysis of Schaeffer Lake evolution between 1951 and 2021.
Figure 4. Assessing the accuracy of differencing the three digital terrain models (DTMs) used in our assessments of elevation change. The difference in elevation values was extracted from a 30 m x 30 m area that appeared to have remained stable and undisturbed between 2016 and 2022. Left, 2022 DTM versus 2016 DTM; middle, simulated DTM versus 2016 DTM; right, simulated DTM versus 2022 DTM.
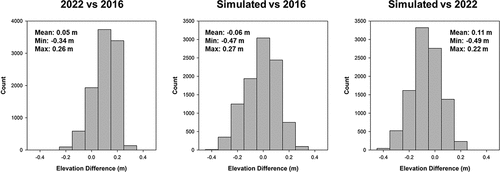
Figure 5. Evidence for beaver burrowing as a thermokarst lake drainage mechanism (red circles and ovals). (a) A beaver showed up in the lake a week before the lake drained for the first time in at least four years (photo credit: Susan Schaeffer Tessier). (b) An image acquired by the drone system during a flight down the drainage gully showing beaver-chewed wood (photo credit: Benjamin Jones). (c) and (d) Beaver chew on the bush near the location where the drainage gully formed (photo credit: Tim Tessier).
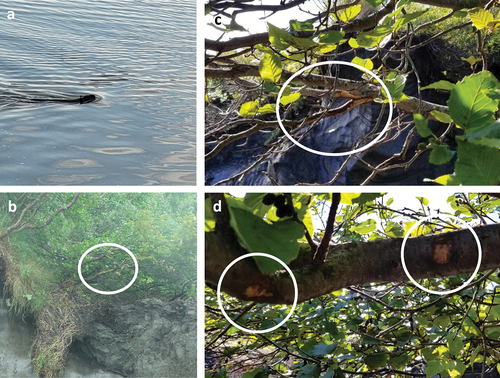
Figure 6. Remote sensing time series showing the evolution of Schaeffer Lake between 1951 and 2021. Historic photography is from 1951, 1974, and 1993. High-resolution commercial satellite imagery is from 2007 and 2021. The lake area increased by >300 percent between 1951 and 2021, prior to its drainage in 2022. The grid in the lower row measures 30 m × 30 m. ©2023 Maxar.
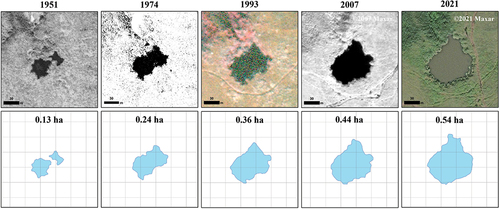
Table 2. Reconstructing the evolution of Schaeffer Lake between 1951 and 2021.
Figure 7. Elevation changes using DTMs acquired in 2016 and 2022. (a) A DTM derived from a point cloud based on structure-from-motion analysis of airborne digital photography acquired on 1 September 2016. (b) A DTM derived from a point cloud based on structure-from-motion analysis of drone system digital photography acquired on 22 August 2022. (c) Elevation changes exceeding 0.5 m for the thermokarst lake and drainage gully between the 2016 and 2022 DTMs. Elevation change values indicate subsidence, lake level lowering, and thermo-erosion.
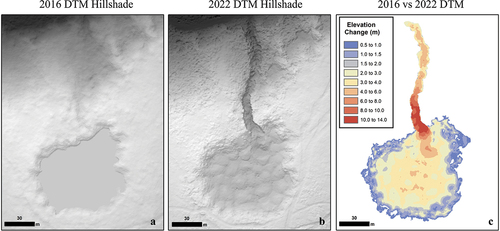
Figure 8. (top) Colorized point clouds developed using structure-from-motion techniques with imagery acquired from a plane (1 September 2016; Fairbanks Fodar Citation2019) and a drone system (22 August 2022). The thermo-erosional drainage gully is evident in the 22 August 2022, fifty-four days after the thermokarst lake drained. Note the patterned ground associated with melting ice wedges and degrading permafrost that was still present on the lake bottom. The dashed transect lines refer to the topographic plots shown below. DTM profiles showing the elevation differences associated with the lake drainage event. Transect a is a profile across the middle of the lake. It shows thermokarst lake expansion between 2016 versus 2022 as well as the drainage of the lake. Transect b is a profile across the upper portion of the gully that was formed during the drainage event. The maximum downcutting is estimated at 13 to 14 m. Transect c is a profile across the lower portion of the gully, ~100 m downslope of where the lake failure occurred. Note that the x-axis and y-axis are the same scale for each of the transects.
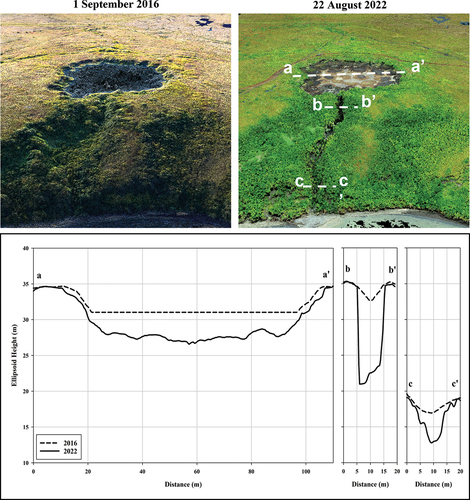
Figure 9. Estimating the magnitude of permafrost thaw subsidence using a simulated DTM and the drone system DTM acquired on 18 August 2022. (a) We simulated an “original surface” DTM by digitizing the predrainage lake perimeter, masking it from the 2016 DTM, replacing the values from an adjacent representative upland of the same slope, and then aggregating and resampling the gridded elevation data. (b) The drone system DTM clipped to the extent of Schaeffer Lake in 2021, prior to drainage. (c) Thaw subsidence estimated by differencing the simulated DTM and the drone system DTM. The white polygons in the image represent the lake perimeter at various times in the past. This was used to estimate thaw subsidence magnitude and rates over time.
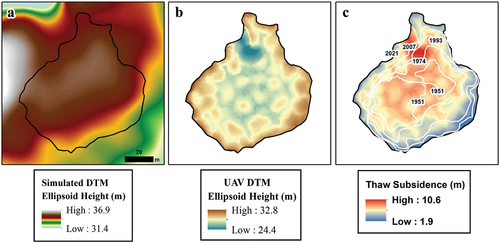
Figure 10. Estimated mean terrain subsidence magnitude and rates based on the difference in elevation between the simulated DTM and the drone system DTM relative to the time periods of thermokarst lake expansion determined with the remote sensing time series imagery. As shown here, thermokarst processes led to rapid rates of subsidence in the first decade following disturbance but diminished over time as the lake deepened.
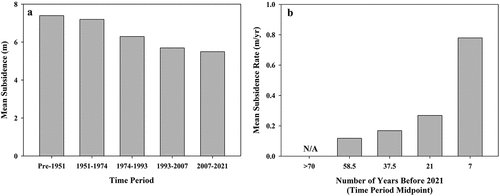
Figure 11. (a) from Mackay (Citation1988) depicting the process of lateral, subsurficial drainage via underground tunnel flow, through a process known as ice wedge tunneling, which happens through contraction cracks developed during the previous winter. This lake drainage process likely caused the drainage of Schaeffer Lake. (b) Topographic profiles extracted from the DTM created using the MACS overflights in June 2021 (black line), the year prior to the lake drainage, and in August 2022 (blue dashed line) after drainage. The lake bank was 2 to 3 m tall where the lake drainage occurred, and a drainage gradient extended away from the lake edge more than 25 m.
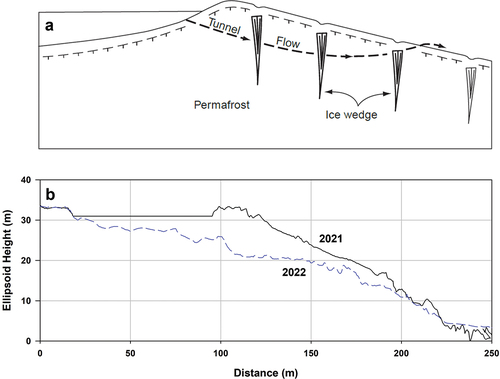
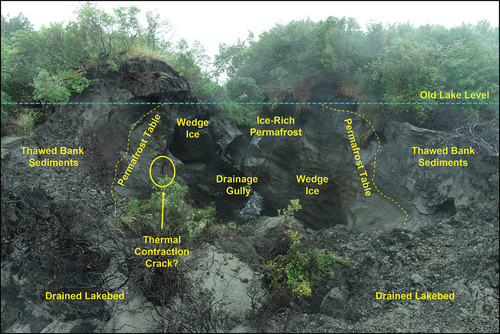
Figure 12. A photo taken by the drone system in August 2022 of the Schaeffer Lake drainage gully. Annotations have been added to the photo showing the lake level prior to drainage, the nearshore permafrost table and thawed bank sediments, a potential remnant contraction crack, wedge ice, and ice-rich permafrost exposed in the drainage gully. The lake likely drained because of tunnel flow through thermal contraction cracks in ice wedges. Thawed bank and sub-lake sediments could have permitted beaver burrowing near where the lake drained.