Figures & data
Figure 1. The Westfjords of Iceland.
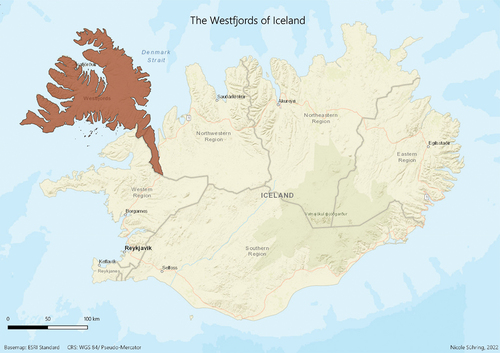
Figure 2. Climate change signal in number of storm days per year (see definition in the Methods section) for the period 2071–2100 relative to 1980–2010 according to SMHI-LENS and SSP3–7.0; results that are statistically insignificant (p > .05 according to 1,000-fold bootstrapping) are hatched. The rough outline of Iceland is center, with the east coast of Greenland on the left. We define storm days as days exceeding the ninety-fifth percentile of daily wind speeds of the fifty members of the historical data experiment (reference period 1970–2014), calculated individually for every grid box of the climate model. For the future scenarios we keep these thresholds and analyze whether exceedances occur more or less frequently in the climate model.
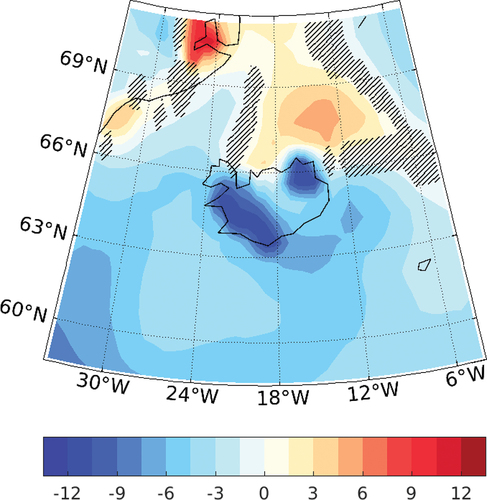
Figure 3. Overview of results. Perceived impacts, threats, problems, and adaptation strategies of fisheries and aquaculture businesses in the Westfjords to storms and extreme weather events, using a modified version of the analytical framework from Macusi et al. (Citation2020).
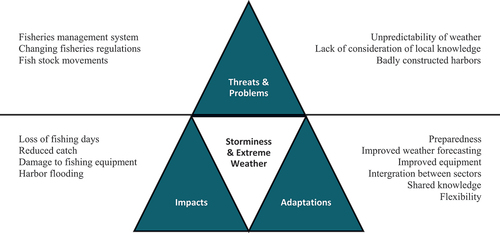
Figure 4. The GK 57 trawler in high waves in the south of Iceland. Photo credit: Jón Steinar Sæmundsson.
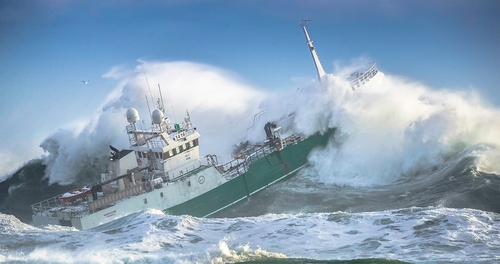
Figure 5. Future research needs and directions based on interview findings.
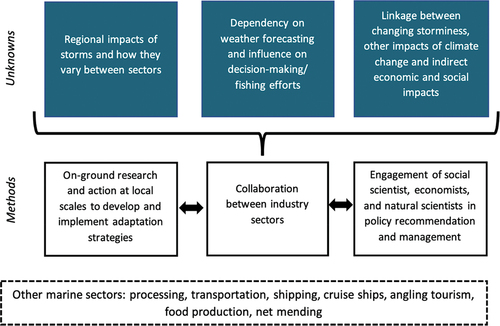
Figure A1. Ninety-fifth percentile of daily mean 10 m wind speed (in m/s) calculated over the reference period 1970 to 2014 for (left) SMHI-LENS and (right) the ERA5 reanalysis.
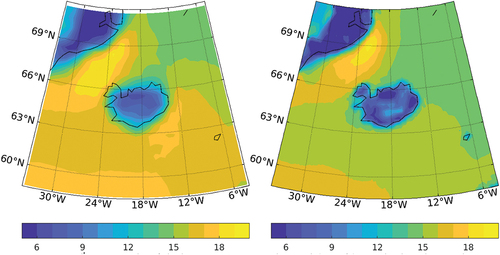
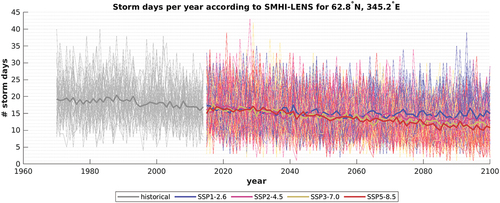
Figure A2. Number of storm days per year for an example grid box southeast of Iceland according to individual SMHI-LENS ensemble members (thin lines) and ensemble mean (thick line) for the historical period 1970 to 2014 (gray) and the future climate 2015–2100 according to four different SSP scenarios (colored).