Figures & data
Table 1. Summary of the research work carried out by various authors for the estimation of snow avalanche impact pressures.
Figure 1. A view of the (a) snow chute at Dhundhi, Himachal Pradesh, India. (b) AIPMS on the test bed of the chute (at a distance of 0.9 m from the end of the 12° slope).
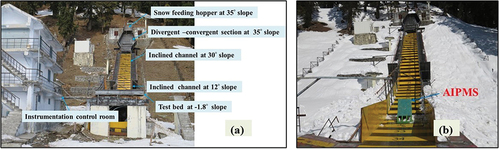
Figure 2. Schematic of the AIPMS showing (a) its position at a distance of 0.9 m from the end of the 12° slope of the snow chute, (b) its front plate facing the avalanche, and (c) side view showing the back support detail.
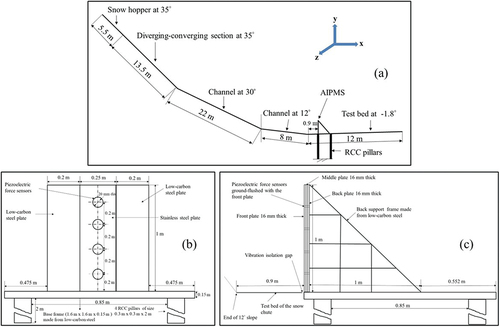
Figure 3. A view of the AIPMS installed on snow chute, Dhundhi, Himachal Pradesh, India.
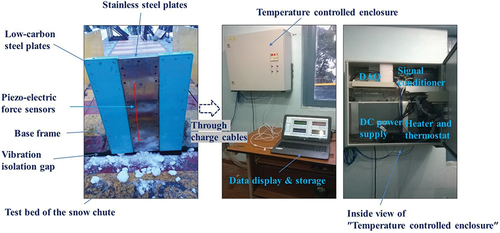
Figure 4. A view of the interaction of the snow avalanches with AIPMS at the snow chute, Dhundhi, Himachal Pradesh, India.
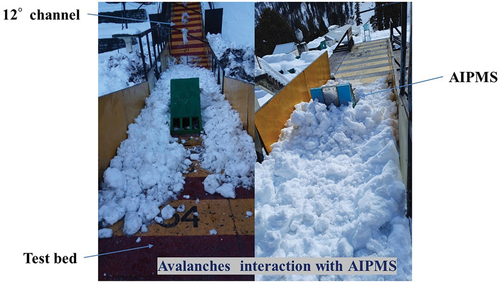
Figure 5. Boundary conditions for the 3D geometry of the snow chute at Dhundhi, Himachal Pradesh (Aggarwal and Kumar Citation2012).
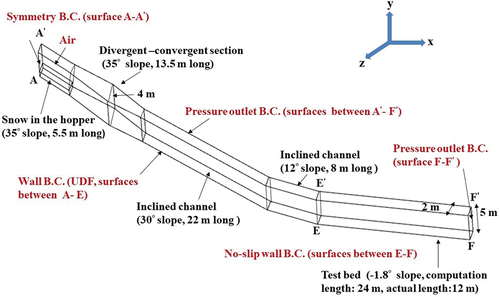
Figure 6. Wall shear stress components of snow on an inclined plane. τs|wall (N·m−2) stands for the total wall shear stress of snow, τs,x|wall (N·m−2) stands for the x-component of τs|wall, τs, y|wall (N·m−2) stands for the y-component of τs|wall, and θ (°) is the angle of the plane.
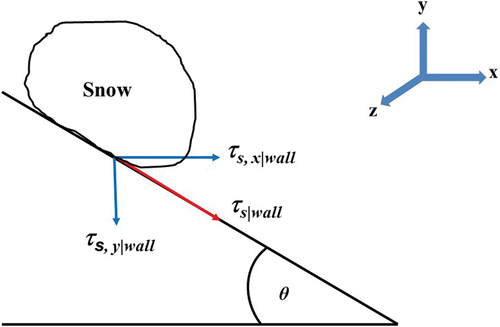
Figure 7. Flow rheology of snow as a bi-viscous Bingham fluid. τ0 (N·m−2) stands for the yield strength of snow, (N·s·m−2) stands for the dynamic viscosity of snow in the locked portion of the flow, k (N·s·m−2) stands for the dynamic viscosity of snow after the yield region, and
(s−1) stands for the shear strain rate of snow in the locked portion of the flow.
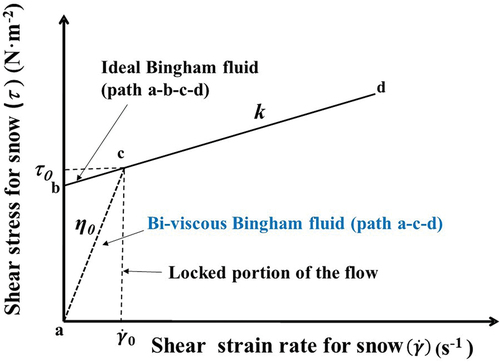
Figure 8. Contours of snow velocity vS at a timestep t = 1.5 seconds, after the release of 11 m3 of snow of density ρi = 582 kg·m−3 from the hopper of the snow chute, Dhundhi, Himachal Pradesh, India, for the varying mesh sizes of (a) 0.05 m, (b) 0.1 m, and (c) 0.2 m (15 March 2021; experiment E2).
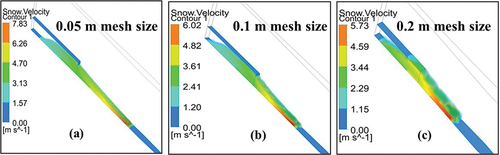
Table 2. Effect of the mesh size on the model simulations.
Table 3. Summary of the experiments for the measurement of avalanche impact pressure Pm at the snow chute, Dhundhi, Himachal Pradesh, India.
Figure 9. Variation of simulated Reynolds number Re and Froude number Fr of the flowing snow shown as a function of time t, just after the snow is released from the hopper of the snow chute, Dhundhi, Himachal Pradesh, India, for the demonstration of the dynamic behavior of the chute avalanches versus real avalanches.
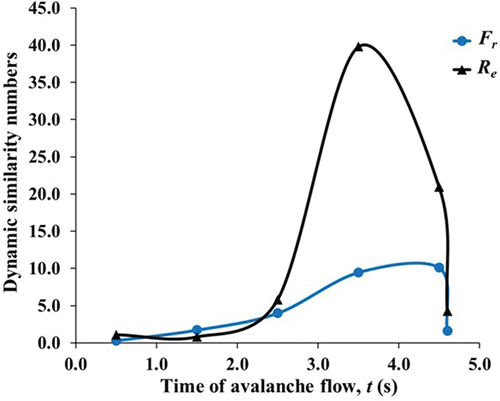
Figure 10. Simulation results of experiment on 17 February 2020 for avalanche flow mass and its interaction with AIPMS at various timesteps t of the flow.
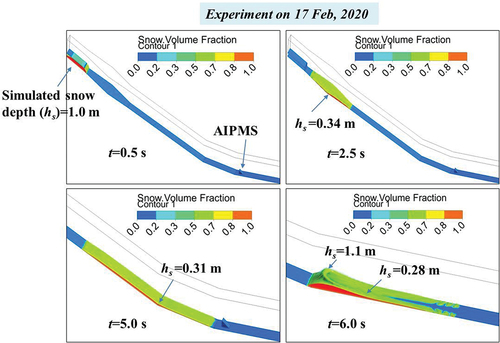
Figure 11. At a timestep t =5.2 s, simulated (a) snow velocity vs and (b) snow total pressure (impact pressure) Ps (17 February 2020).
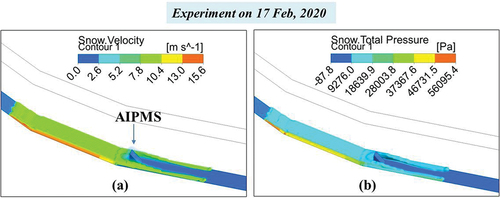
Figure 12. Observation of the avalanche flow and its depth at the significant points on the snow chute at various flow timesteps t during the experiment carried out on 17 February 2020.
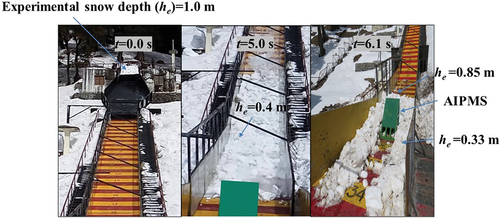
Figure 13. Simulated versus measured avalanche impact pressures at (a) 0.2-m and (b) 0.6-m depth from the snow chute test bed surface (14 February 2020, 17 February 2020, and 23 February 2020).
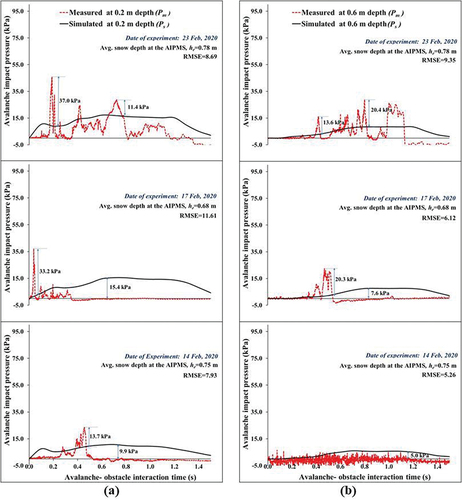
Figure 14. Simulated versus measured avalanche impact pressures at (a) 0.2-m depth and (b) 0.6-m depth from the snow chute test bed surface (15 March 2021, experiment E1; 18 March 2021; and 19 March 2021).
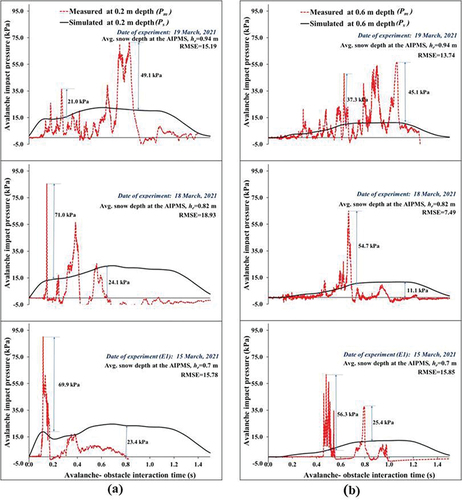
Table 4. Ratio Rp of the peak values of the measured avalanche impact pressures Pm,max and simulated avalanche impact pressures Ps,max.
Figure 15. Measurement of the avalanche impact pressures Pm by AIPMS after complete blocking of the avalanche flow from the sides with barriers (15 March 2021, experiment E2).
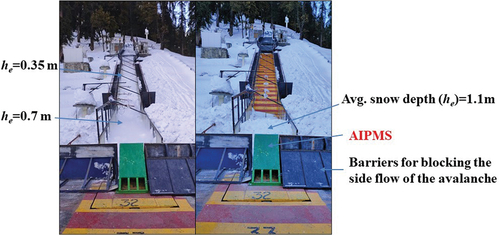
Figure 16. Simulated versus measured avalanche impact pressures after complete blocking of flow from the sides with the barriers at (a) 0.2-m depth and (b) 0.6-m depth from the snow chute test bed surface (15 March 2021, experiment E2).
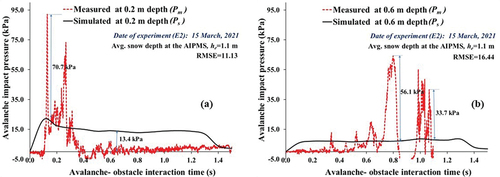
Figure 17. Variation of simulated fluid drag coefficient Cd and the corresponding effective drag coefficient during the avalanche flow–obstacle interaction process for experiments conducted on (a) 15 March 2021 (experiment E1, ρi = 578 kg·m−3) and (b) 14 February 2020 (ρi = 325 kg·m−3).
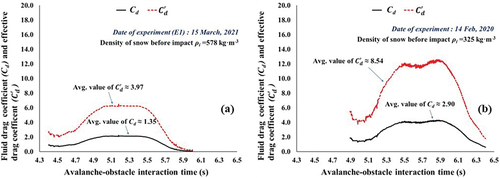
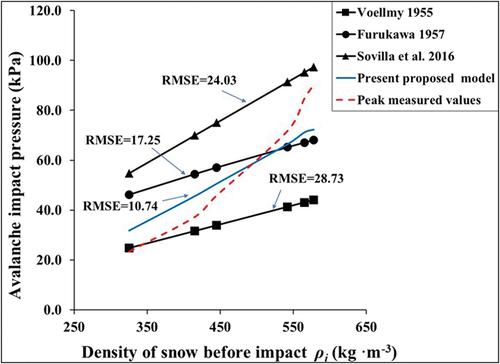
Figure 18. Comparison of deviations between the output of the proposed model Pi and other well-known models for the estimation of peak avalanche impact pressures on the obstacles. Deviations for the above models were calculated with reference to the peak measured avalanche impact pressures Pm,max in the current experiments.