Figures & data
Figure 1. (a) Geographic location and (b) basin distribution in the study area: (I) Jialing River Basin, (II) Yellow River Basin, (III) Minjiang River Basin, (IV) Yalong River Basin, and (V) Jinsha River Basin). (c) Administrative divisions and topography.
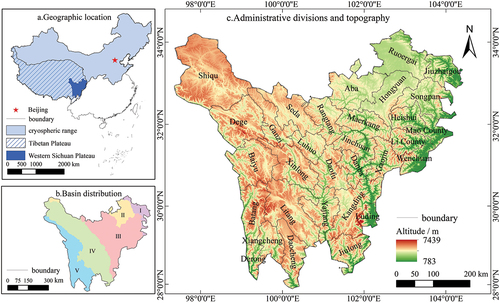
Table 1. Vulnerability assessment index system of cryosphere changes in the Western Sichuan Plateau.
Table 2. Type of interaction detection.
Figure 2. Spatially distributed vulnerability levels of cryosphere changes in the Western Sichuan Plateau. (a) Spatial distribution of Vulnerability levels. (b) Spatial distribution of Exposure levels. (c) Spatial distribution of Sensitivity levels. (d) Spatial distribution of Adaptability levels.
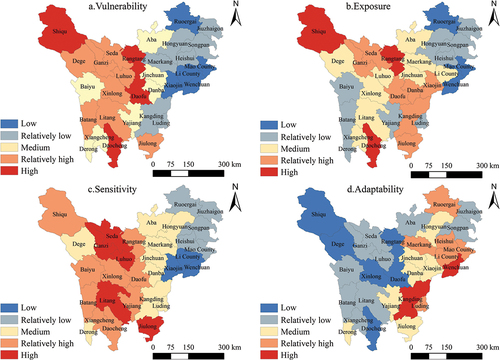
Figure 3. Spatial relationship and LISA cluster map of vulnerability to cryosphere changes in the Western Sichuan Plateau. (a) Moran Scatter Chart of Vulnerability. (b) LISA Cluster Chart of Vulnerability.
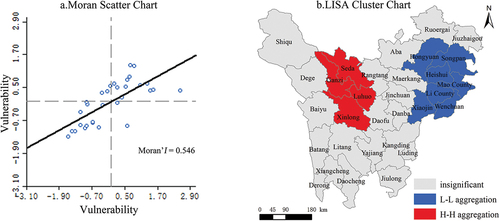
Figure 4. Spatial relationship between dimensions of vulnerability to cryosphere changes in the Western Sichuan Plateau. (a) Moran Scatter Chart of Exposure and Sensitivity. (b) Moran Scatter Chart of Exposure and Adaptability. (c) Moran Scatter Chart of Sensitivity and Adaptability.
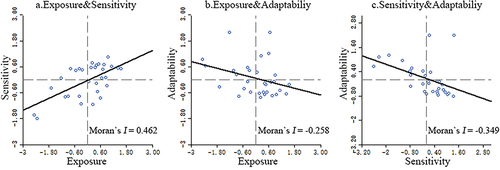
Table 3. Detection results of influencing factors on the vulnerability to cryosphere changes in the Western Sichuan Plateau.
Figure 5. Interaction detection results of influencing factors on the vulnerability to cryosphere changes in the Western Sichuan Plateau.
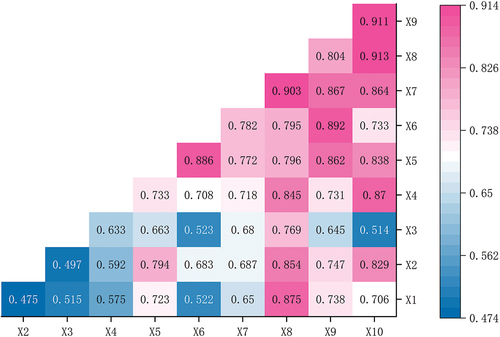
Table 4. Changes in the number and area of glaciers in the Western Sichuan Plateau from 2007 to 2017.
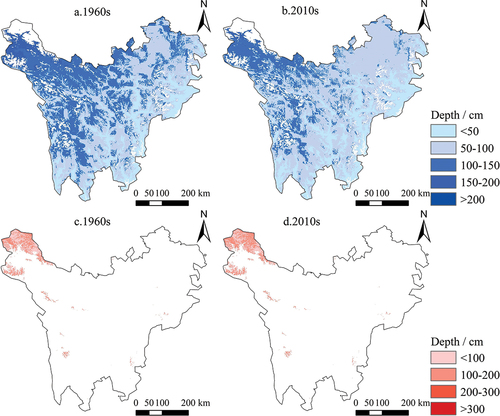
Figure 6. Distribution and changes of various types of permafrost in the Western Sichuan Plateau: (a) maximum freezing depth of seasonal permafrost in the 1960s, (b) maximum freezing depth of seasonal permafrost in the 2010s, (c) active layer thickness of perennial permafrost in the 1960s, and (d) active layer thickness of perennial permafrost in the 2010s.