Figures & data
Figure 1. True color image of the Uinta Mountains from the NAIP program, 2014. The location of the Chepeta weather station is marked by a yellow triangle within the black box delineating the study area shown in . Letters “a–d” refer to photographs in symbols display the approximate orientation of each of the images. Inset shows the position of the weather station (yellow triangle) within the Rocky Mountain system (dark gray) in western North America. The state of Utah (UT) is highlighted in black.
Figure 3. (a) Orthophoto mosaic of the Chepeta site derived from images collected by a UAV. Brown lines are 1 m contours. For clarity, contours are not shown on the steep headwall descending down into the cirque to the north. The GPR transects are shown as white lines: West (W), East (E), and the pair of crossing transects at the soil pit (P). (b) Slope map of the area shown in panel ‘a’. Values clipped to ≤15° to highlight the summit flat surface. Inferred regolith thickness (in m) along the GPR transects is presented with overlapping colored dots. Regolith tends to be thicker under higher topography at the southern ends of the long transects where slopes are lower. (c) Photograph looking to the south toward the Chepeta weather station (on horizon) along the path of the East transect showing the typical surface of the summit flat in the study area.
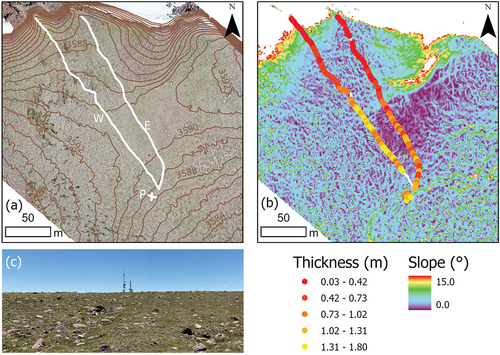
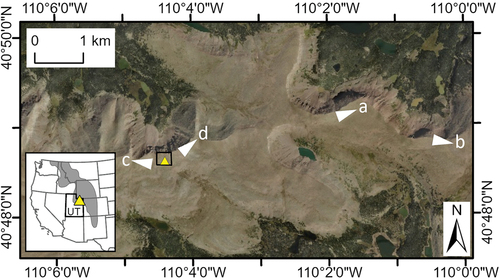
Figure 3. (a) Orthophoto mosaic of the Chepeta site derived from images collected by a UAV. Brown lines are 1 m contours. For clarity, contours are not shown on the steep headwall descending down into the cirque to the north. The GPR transects are shown as white lines: West (W), East (E), and the pair of crossing transects at the soil pit (P). (b) Slope map of the area shown in panel ‘a’. Values clipped to ≤15° to highlight the summit flat surface. Inferred regolith thickness (in m) along the GPR transects is presented with overlapping colored dots. Regolith tends to be thicker under higher topography at the southern ends of the long transects where slopes are lower. (c) Photograph looking to the south toward the Chepeta weather station (on horizon) along the path of the East transect showing the typical surface of the summit flat in the study area.
Figure 2. Photographs of summit flats in the Uinta Mountains. (a) Classic expression of periglacial summit flats truncated by alpine glacial erosion on both sides. (b) Exposed bedrock at the top of a glacial headwall capped by regolith at the edge of a summit flat. (c) The flat-floored saddle hosting the Chepeta site viewed from the west. The white oval highlights the Chepeta weather station. (d) The Chepeta site viewed from the northeast. Photopoint locations and orientation of each image are shown in .
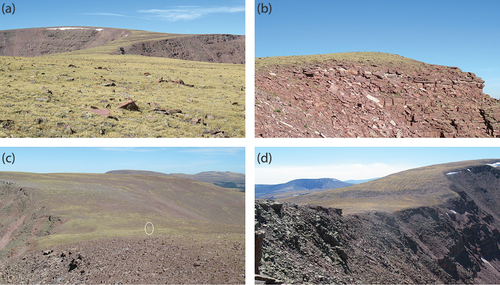
Figure 4. GPR data for the West (top) and East (bottom) transects. Horizontal and vertical scales are in m, and vertical exaggeration is 4.25:1. Arrows highlight the prominent reflector interpreted to be the bedrock surface beneath the regolith. Vertical white lines mark the points measured along the transect at 18-m intervals used to define the horizontal scale.
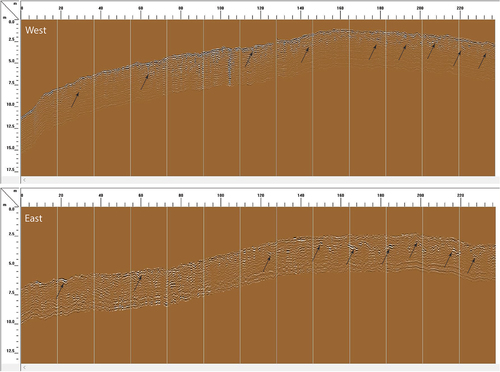
Figure 5. GPR profile for one of the short crossing transects at the soil pit (). Arrows highlight the prominent reflector interpreted to be the bedrock surface beneath the regolith. The dashed vertical line marks the center of the soil pit where bedrock was not encountered within 92 cm of the surface; GPR data suggest the bedrock contact is at a depth of ~100 cm. The dimensions of the pit are presented as the black box. Vertical exaggeration is 0.9:1. Upper right shows a field sketch of the cryoturbated soil horizons observed in the pit and a possible correlation to the GPR data.
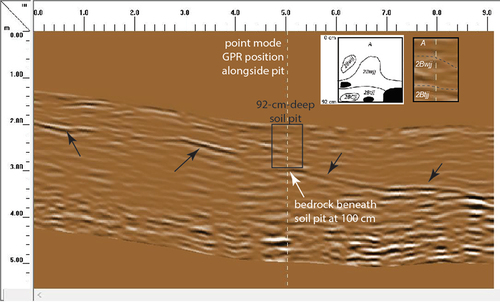
Figure 6. Profiles of the ground surface (green) and regolith (brown) along the West and East transects. Regolith thickness is plotted at the bottom for comparison. Roughness values for the ground surface (green) and bedrock surface (brown) are presented as mean ± 1 standard deviation. Dots on the regolith thickness plot mark points digitized in the GPR data to trace the bedrock-regolith contact (n = number of points along each transect). Vertical exaggeration is 13:1.
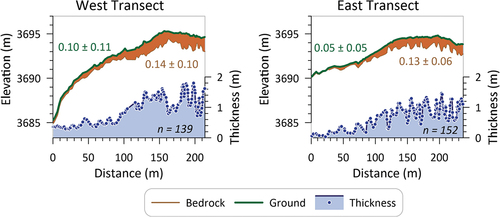
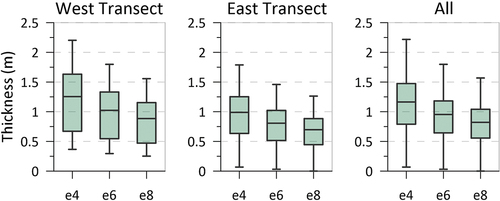
Figure 7. Box and whisker plots of regolith thickness along the West (n = 139) and East (n = 152) transects, as well as for the composite of all measurements at the Chepeta site (n = 369). Thickness was estimated with 3 different values of dielectric permittivity (ɛr): 4, 6 and 8.