
Figures & data
Figure 1. (left) Map of the Arctic. The North Pole is in the middle (small black cross); oceans are in blue and land is in white. The land mass on the right-hand side shows the northern part of the Eurasian continent. A red circle indicates the location of the study site in the middle basin of the Lena River (gray line passing through the red circle). (middle) photograph of Khotu Alas taken by the Ikonos satellite in July 2002. (right) Schematic soil map of approximately the same area as depicted in the photograph. A red line marks the border of Khotu Alas and the lake in its center is in blue. The pattern associated with the numbers indicates the soil types listed in : (1) Histic Reductaquic Cryosol, (2) Gleyic Cryosol, (3) Turbic Chernic Cryosol. Pattern 4 covers the area unaffected by thermokarst processes.
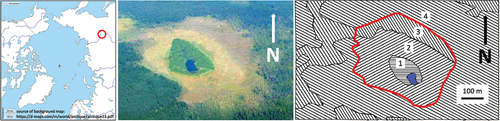
Table 1. Position, soil type, and vegetation parameters as found at the three investigated sites in August 2017.
Table 2. Properties of the top 10 cm of soil at the three investigated sites.
Table 3. Taxa found at the three investigated sites in terms of average number of specimens (± uncertainty) and relative abundance (%).