Figures & data
Figure 1. The upper row shows historic air photos from 1951, 1984, and 2007 (United States Geological Survey Earth Explorer) that illustrate the expansion of agricultural fields of a farm in Fairbanks, Alaska. The expansion of agricultural fields removed the native insulating vegetation and exposed the underlying permafrost to climate-driven thaw. The lower row shows that this permafrost proved to be ice rich from up to 1.05 m of subsidence measured between 2011 and 2017 from Light Detection and Ranging datasets (Alaska Division of Geological and Geophysical Surveys Citation2013).
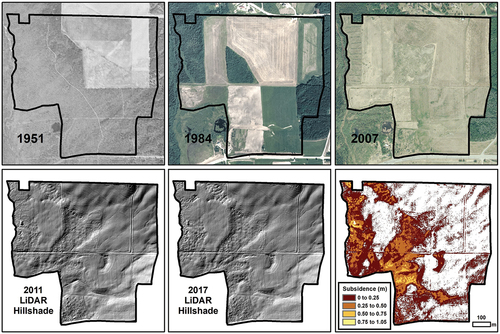
Figure 2. Above shows the percentage of the total permafrost land per country for countries with permafrost representing 10 percent or more of their areas. Permafrost dataset (Obu et al. Citation2019a) based on modeling ground temperatures at the top of permafrost between 2000 and 2016. The graph also shows total agricultural land (defined as arable land and/or permanent pastures) in 2016 (https://datacatalog.worldbank.org/home). Below shows the total permafrost area divided into permafrost zones based on the lateral continuity of permafrost. While the likelihood of permafrost occurrence increases with increasing permafrost area and agricultural activities present, the exact location is unknown due to nonexistent and patchy datasets. *Nonglaciated areas. **Includes Svalbard within calculation of permafrost area but not in agricultural land, as there are currently no known agricultural activities on Svalbard.
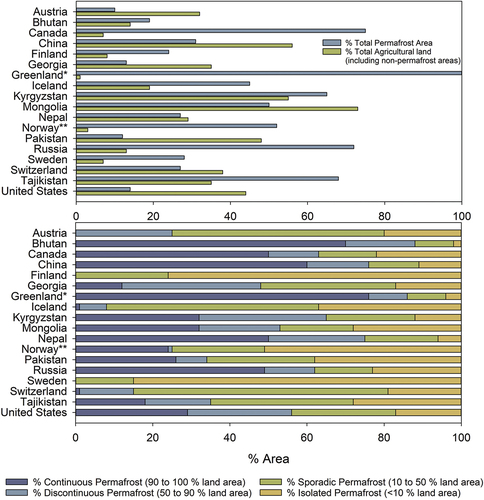
Figure 3. Distribution of permafrost within the Northern Hemisphere and locations of case studies. Geospatial data from Obu et al. Citation(2019a). Countries with permafrost representing 10 percent or more of their territories, identified in , are shaded light gray. The northern Fennoscandia study area was mapped based on Stoessel, Moen, and Lindborg (Citation2022). This analysis serves as a proxy for identifying areas with a greater likelihood of containing permafrost-agroecosystems, as the exact locations are currently unknown due to patchy or nonexistent datasets. Such geospatial datasets would allow monitoring of any growth and decline of agricultural activities; measure and monitor environmental changes, such as changes in vegetation, thermokarst, and carbon cycling; and could aid in policy development and governance.
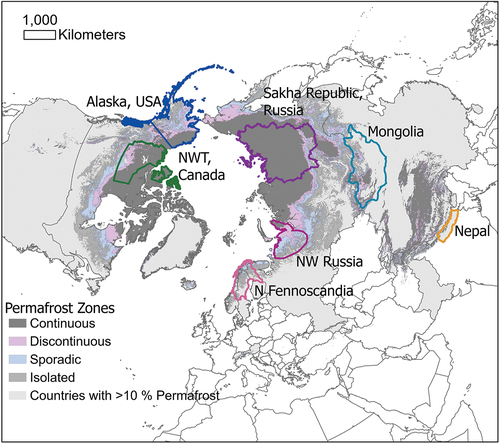
Table 1. Overview of case studies and recent mean annual air temperature warming trends.
Figure 4. (A) Plastic mulch application caused a thermokarst pit to develop along a fencepost at a farm in Fairbanks, Alaska. (B) The impact of soil heating from a 22-day geotextile mulch application during the 2022 growing season. (Data available at Ward Jones, Gannon, and Jones Citation2024.) Ground heated as much as 7.6°C at the surface and 1.5°C at 1 m depth compared to a carrot crop with no mulch.
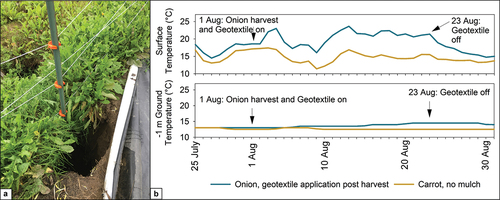
Figure 5. Raised beds by the Indigenous community of Kakisa (left) and commercial potato farm in Paradise Gardens, NWT (right).
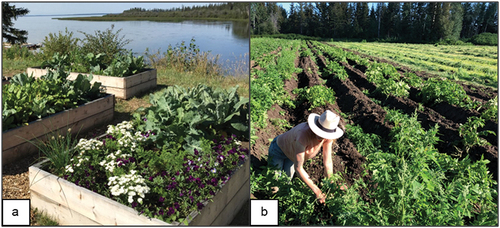
Figure 6. Alaas amid the forest plateaus on ice-rich permafrost, such open grasslands provide suitable ecological conditions for pasture and hay-making—and thus the basis for the Sakha pastoral culture. Photo: M. Ulrich, July 2014.
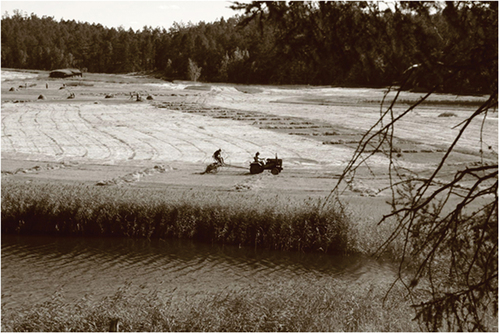
Figure 7. Yak and cattle spending a spring afternoon by an aufeis sheet in a valley near Terelj, Mongolia. Photo: J. O. Habeck, March 2019.
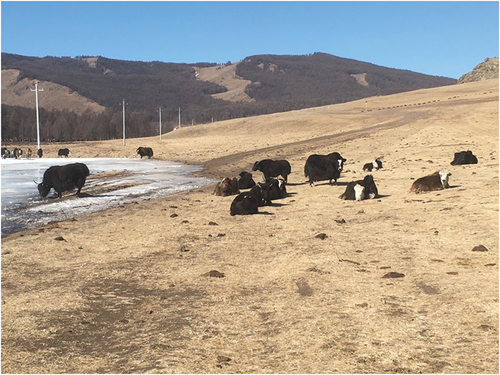
Figure 8. (a) Thaw slumps in the lower permafrost zone in Langtang (~4,000 m a.s.l.) located between frequently used herder huts. (b) Thaw slump close to a hut in Humla. (c) One of the bigger transhumances in Langtang, threatened by debris flows from higher areas on the left and right, now lies abandoned, with the main river arm below. (d) Typical yak grazing grounds in Humla at the lower margin of permafrost occurrence.
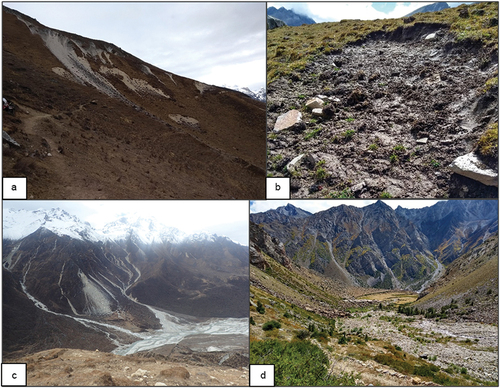
Table 2. Characteristics of the case study sites, distribution of settlement infrastructure, agricultural land and huts (transhumance) for yaks and their herders (with total number in brackets) as well as their respective distances to permafrost.
Figure 9. Palsa in Peera near Kilpisjärvi, Finland. This palsa is thawing fast; on the sides there are small thermokarst ponds. The top of the palsa rises 1 to 2 meters above peatland surface and creates a rather dry habitat, where lichen and dwarf shrubs are common. As the top of palsa has a thinner snow cover than the surrounding peatland, in spring they are the first snow-free spots in peatland and attract reindeer to graze there. Drone photo: T. Kumpula, August 2023.
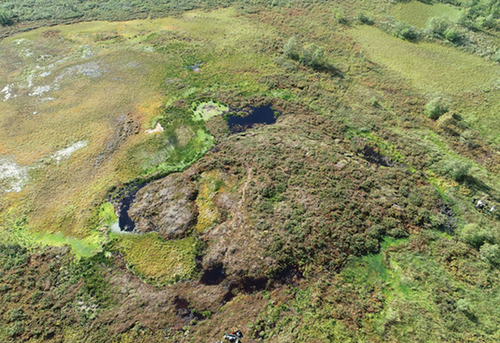
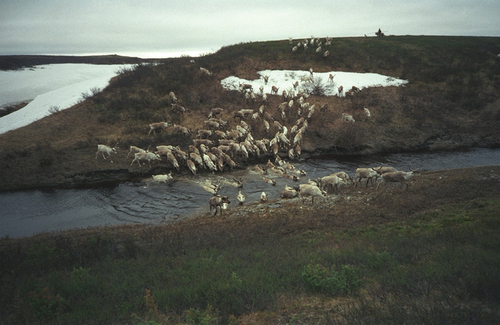
Figure 10. Komi reindeer herders driving part of their herd through a spring-thaw freshet (near Khorei-Ver, Russia). Photo: J. O. Habeck, June 1999.