Figures & data
Figure 1. Location of Urmuqi River Basin, Yanggong River Basin, and hydrological/meteorological stations.
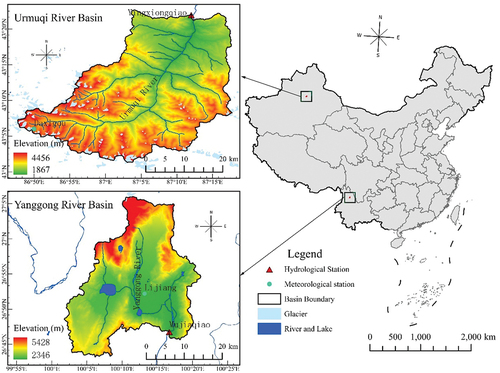
Table 1. List of data sources in this study.
Figure 2. Interannual variation of runoff in the Yanggong River Basin and Urmuqi River Basin from 1979 to 2017.
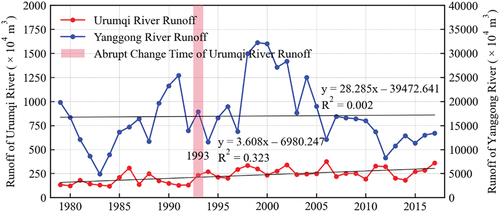
Figure 3. Variations of monthly runoff in the Yanggong River Basin (a) and Urmuqi River Basin (b).
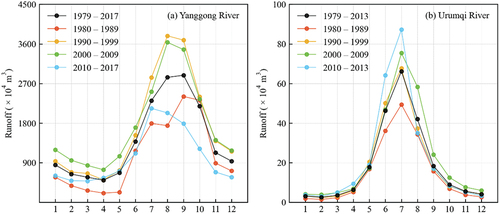
Figure 4. Interannual variation of precipitation in the Lijiang and Daxigou automatic weather stations from 1979 to 2017.
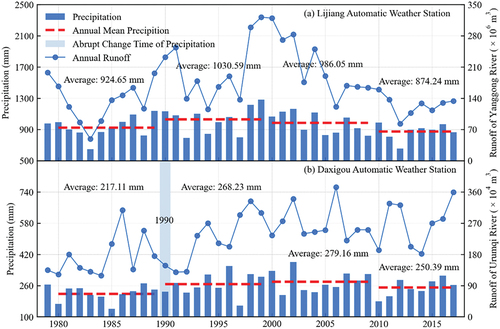
Table 2. Pearson correlation coefficient between monthly runoff and meteorological factors in the Yanggong River Basin and Urmuqi River Basin.
Figure 5. Interannual variation of temperature in the Lijiang and Daxigou automatic weather stations from 1979 to 2017.
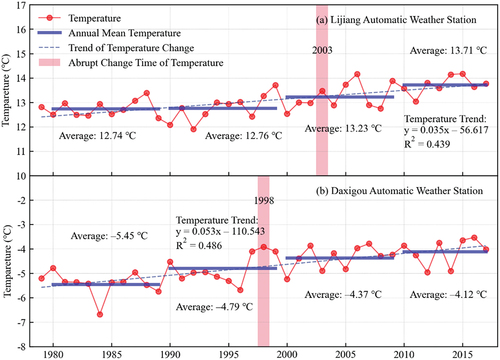
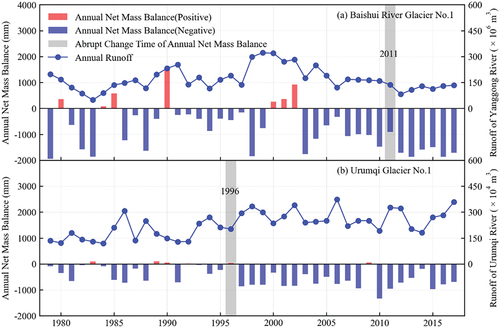
Figure 6. Interannual variation of mass balance in the Baishui River Glacier No. 1 and Urumqi Glacier No. 1 from 1979 to 2017.