Figures & data
Figure 1. The Blue Marble. Source: NASA/Apollo 17 crew; taken by either Harrison Schmitt or Ron Evans.
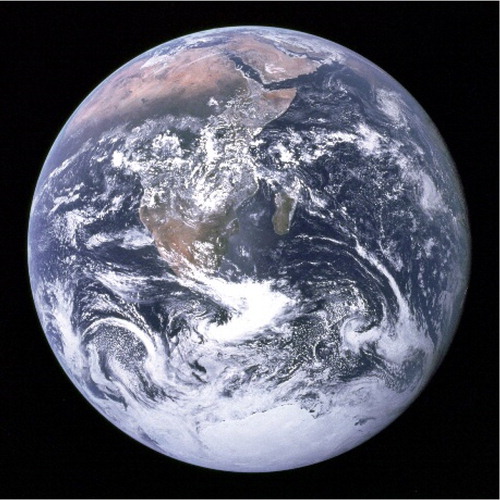
Figure 2. Blue Banana (Bouattou et al., Citation2017).
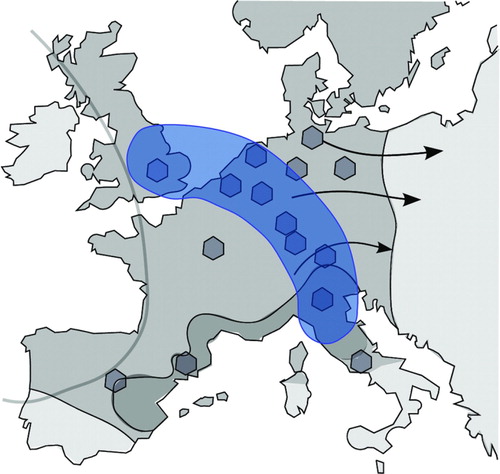
Figure 3. Burning Embers Evolution (Schellnhuber, Citation2010).
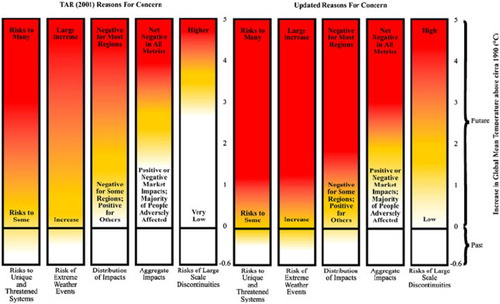
Figure 4. Number of articles about visual* per year between 2000 and 2019.
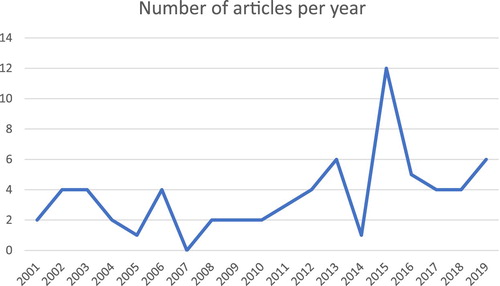
Figure 5. Objectives of the papers about visuals over the years.
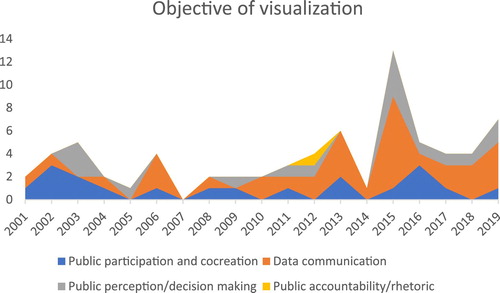
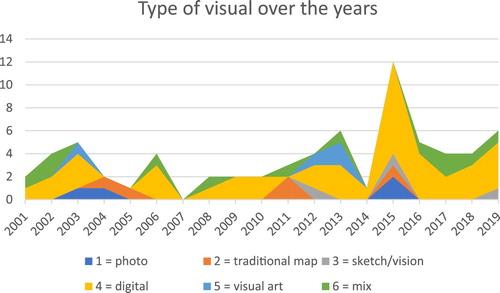
Figure 6. Types of visuals discussed over the years.