Figures & data
Figure 1. Pillars that influence the use of science in policy decisions.

Figure 2. Simplified schematic of the New Zealand policy and regulatory framework for freshwater management.
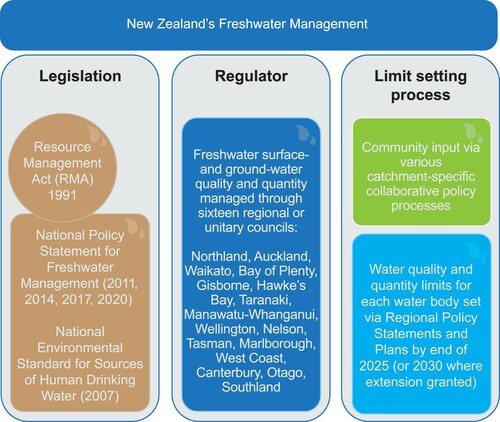
Figure 3. Simplified schematic of the Californian framework for management of freshwater quality, with a focus on the agricultural landscape in the Central Valley Regional Water Board region.
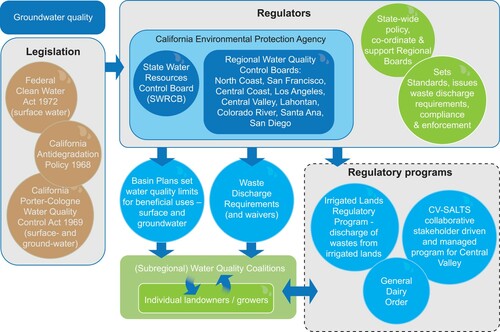
Figure 4. Simplified schematic of the Californian framework for management of groundwater quantity.
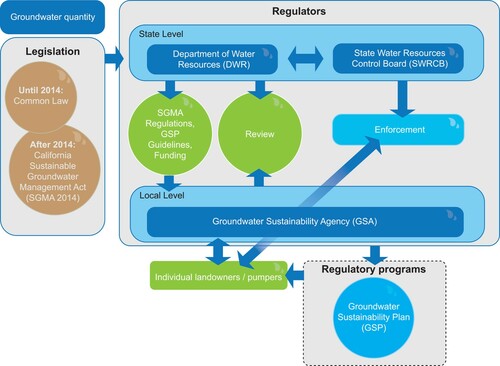
Table 1. Interview sample across policy contexts.Table Footnotea
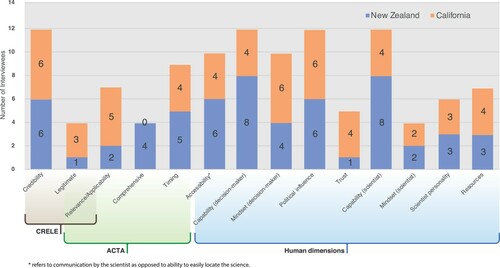
Figure 5. Pillars and elements that describe the influence of science in policy decisions.
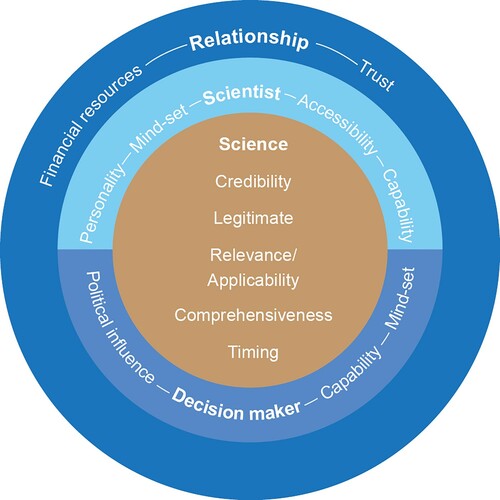
Table 2. Pillars, elements and analysis themes to describe the influence of science in policy.
Figure 6. Percent of statements (n = 168) for each barrier to the influence of science in policy theme.
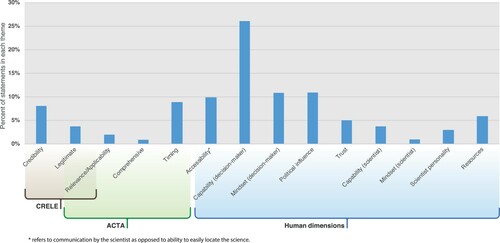
Figure 7. Number of interviewees (n = 16) who noted each barrier to the influence of science in policy theme.