Figures & data
Figure 1. Q chart layout used in the study.
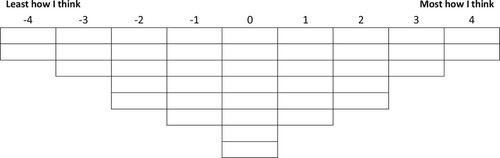
Table 1. Factor data extracted from Q results.
Table 2. Factor scores.Table Footnotea
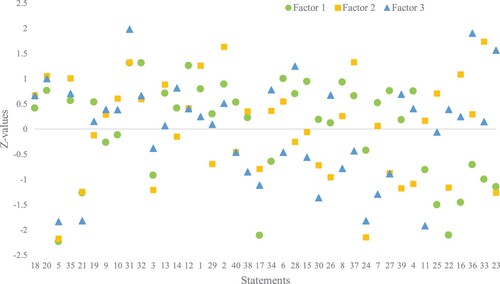
Figure 2. Z-values of the factors for each statement and factor. Statements are ranked in descending order of the standard deviation of the z-values (hence, statements to the left show highest, and statements to the right the lowest consensus).