Figures & data
Table 1. First phase sample size profiles.
Table 2. Main concepts and extracted codes.
Figure 1. Conceptual model of Iran’s tourism development.
Table 3. Demographic profile of the respondents (N = 218).
Table 4. Results of items’ outer loading analysis.
Table 5. Results of construct reliability and validity.
Table 6. Results of discriminant validity based on Fornell–Larcker criterion.
Figure 2. Predictive relevance of the model.
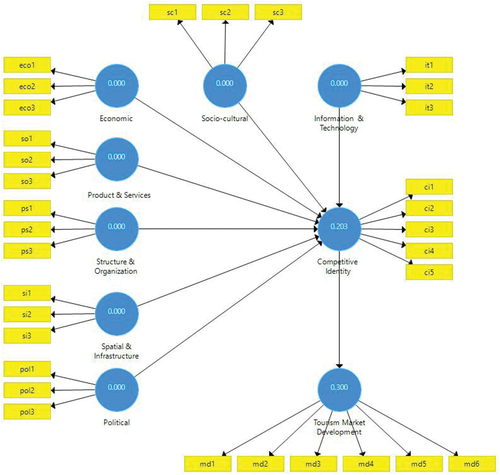
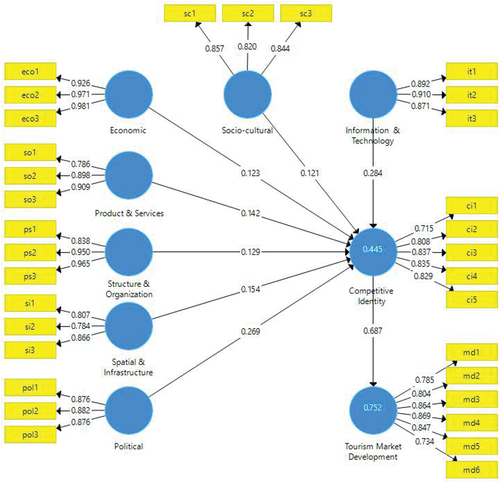
Table 7. Results of hypothetical paths.
Figure 3. Model construction.