
Figures & data
Figure 1. Pyrimidine de novo nucleotide synthesis showing the inhibition of DHO-DH by Brequinar and of orotate phosphoribosyl transferase (OPRT) by pyrazofurin (PZ). DHO-DH is a mitochondrial enzyme located at the outside of the inner membrane, depicted by the two circles (fat outside, thin inside). PRPP (5-phosphoribosyl-1-pyrophosphate) is a co-substrate for the phosphoribosylation of orotic acid to OMP, catalyzed by OPRT.
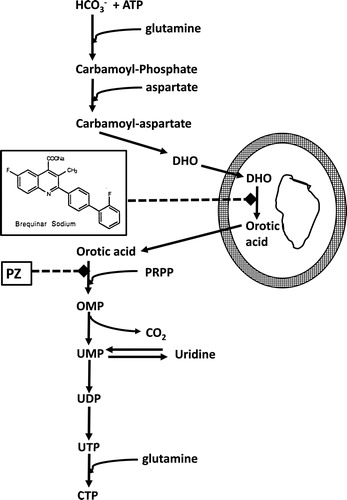
Figure 2. Activity of DHO-DH in several human xenografts from ovarian cancer and head & neck squamous cell carcinoma (SCC) and in the murine colon cancer models Colon 26 (CT26) and Colon 38 (CT38). Inhibition of DHO-DH was achieved by addition of 1.5 μM Brequinar (DUP), a concentration present for several days in plasma of patients treated with Brequinar.[Citation31] Values are means of 4–7 separate tumors ±. SE. Inhibition by Breq was significant for all tumors (paired t-test; p < 0.0005).
![Figure 2. Activity of DHO-DH in several human xenografts from ovarian cancer and head & neck squamous cell carcinoma (SCC) and in the murine colon cancer models Colon 26 (CT26) and Colon 38 (CT38). Inhibition of DHO-DH was achieved by addition of 1.5 μM Brequinar (DUP), a concentration present for several days in plasma of patients treated with Brequinar.[Citation31] Values are means of 4–7 separate tumors ±. SE. Inhibition by Breq was significant for all tumors (paired t-test; p < 0.0005).](/cms/asset/fe9cdddd-7dd5-470d-8d77-e1b92eb7ab55/lncn_a_1508692_f0002_b.jpg)
Figure 3. Superoxide formation after incubation of isolated rat liver mitochondria with 0.3 mM L-DHO for 30 min. Instrumental conditions: magnetic field, center field 3480 G; sweep width 10 G; modulation frequency, 9.78 kHz; modulation amplitude, 0.990 G; gain, 3.20 × 10⁵; power, 50 mW; conversion time, 10.24 ms; number of scans, 20; scan time, 40 s. DMPO was used to trap superoxide which is shown in the typical spectrum in the upper figure. Inhibition of DHO-DH was achieved by addition of 1.5 μM Brequinar. One representative experiment out of 3 is shown.
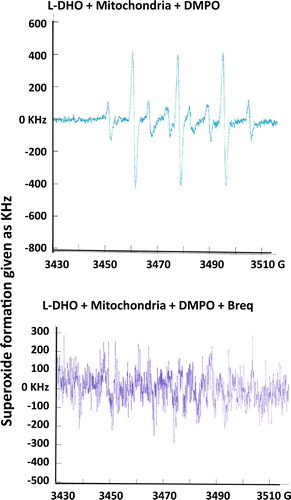
Figure 4. Inhibition of DHO-DH in WBC (4A) and the effect of Brequinar on plasma uridine levels (4B) of patients with solid tumors entered in several Phase II studies at weekly doses of Brequinar at 1500 mg/m2 (#1 and #5), 2000 (#2), 1200 (#3) and 1200 (#4), and twice weekly doses of 600 (# 6) and 750 (#7). (A) Enzyme activities before treatment were set at 100%. From patient #1 we were also able to evaluate two tumor biopsy specimen, one before and one after drug administration. (B) The concentration of plasma uridine before treatment (samples taken in the morning between 9 and 10 am) was 4.9 ± 1.2 μM (range 4.03–6.8 μM); values were calculated by setting the pretreatment level at 100%. The doses of 600 and 750 mg/m2, given twice weekly, showed a slight decrease of uridine after 72 hr for #7 (from 128% to 76%) and even less for #6, possibly within the natural circadian variation.
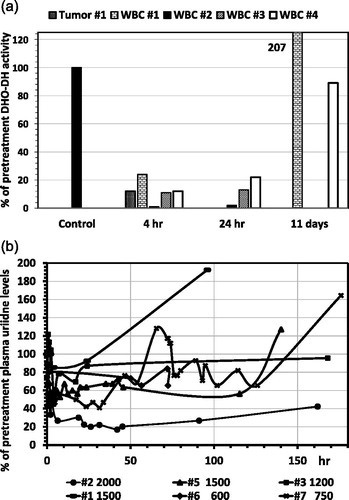
Figure 5. Circadian variation of plasma uridine levels in 6 healthy human volunteers All volunteers received the same diet (evening local Chinese dishes) during this period. The difference between peak and trough concentrations was significant (paired t-test; p < 0.001).
