Figures & data
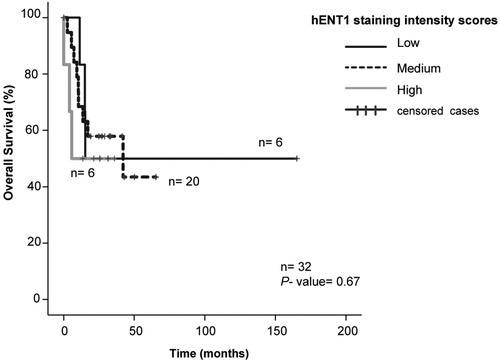
Figure 1. Immunocytochemistry for hENT1 and hCNT1 proteins, as scored by two independent observers in several representative patient samples. Negative control in HL-60 cells was done by omitting one antibody (1 A). Positive controls (1B, 1C) are compared with AML samples of different color intensity (1 D, E, F, G). Low staining was defined as less than one third of the intensity (<0.3) and high staining was defined as the upper fifth of the intensity (>0.8) and medium staining was in between these two intensities (- +).
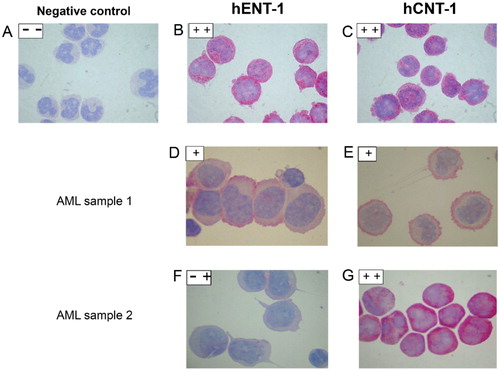
Figure 2. A: Frequencies (count) of samples in low (- -), medium (- +) and high (+ +) staining intensity for hENT1 and (2B) hCNT1. 2C: hENT1 mRNA levels of samples (from ref[Citation15]) allocated to score groups low, medium and high.
![Figure 2. A: Frequencies (count) of samples in low (- -), medium (- +) and high (+ +) staining intensity for hENT1 and (2B) hCNT1. 2C: hENT1 mRNA levels of samples (from ref[Citation15]) allocated to score groups low, medium and high.](/cms/asset/309f03f5-acc9-4bb0-aa01-2323823268e6/lncn_a_1746803_f0002_b.jpg)
Table 1. hENT1 and hCNT1 staining in different AML FAB types.
Table 2. Frequencies of hCNT and hENT samples and staining intensities.
Figure 3. Sensitivity of primary AML samples (depicted as Ara-C LC50 values) in hENT1 (3 A) and hCNT1 (3B) immunohistochemistry score groups.
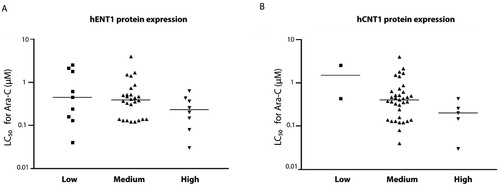
Figure 4. Kaplan-Meier curves of pediatric AML patients with low (black), medium (dashed) and high (gray) hENT1 immunocytochemistry staining intensities. All patients received induction chemotherapy containing an anthracycline (idarubicin or daunorubicin) in combination with ara-C and etoposide.