Figures & data
Figure 1 Sampling sites in this study.
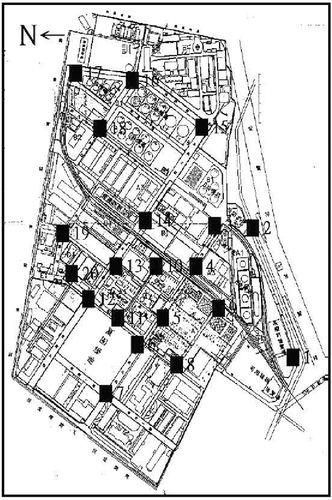
Table 1 Sampling sites in this study
Figure 2 Comparison of different types of VOCs inside the plant (a) in concentration and (b) in percentage.
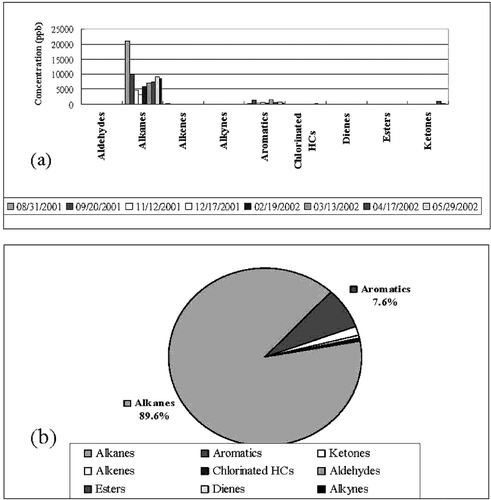
Table 2 Average concentration of alkanes and aromatics at each site
Figure 3 Contour maps for alkanes inside the plant over one year.
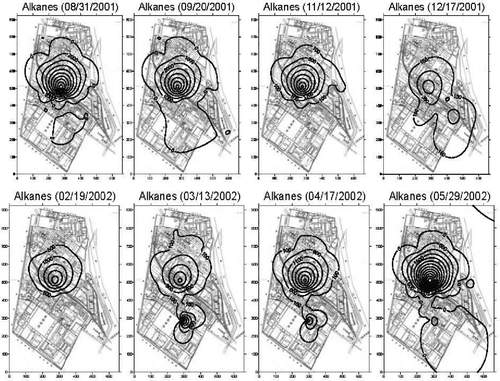
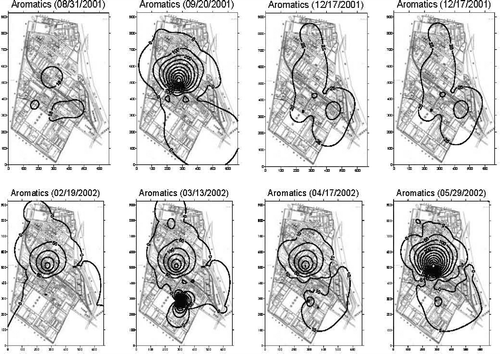
Figure 4 Contour maps for aromatics inside the plant over one year.