
Figures & data
Figure 1. Map of Alberta Oil Sands deposits and surficial sediment sampling locations in relation to surface geology (adapted from Alberta Geological Survey, 2013) and the Alberta Oil Sands deposits (adapted from Auch, Citation2014).
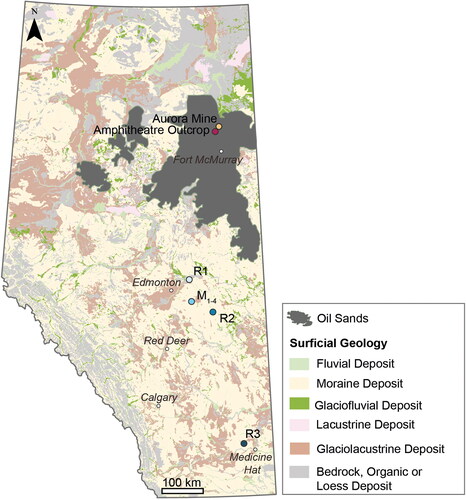
Table 1. Sample locations and sample types used to characterise Alberta Oil Sands geochemical signatures and identify deposits in surficial sediments.
Table 2. Compounds and parameters used to calculate the diagnostic ratios in and .
Figure 2. m/z 217 and m/z 218 ion chromatograms of the saturated hydrocarbon fractions of the Alberta Oil Sands samples showing sterane distributions. The grey shading highlights the key compounds used to calculate the diagnostic ratios in .
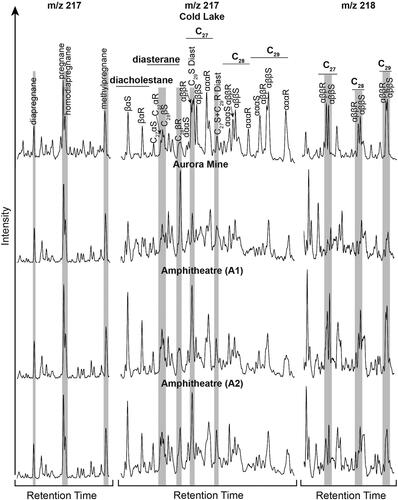
Table 3. Extracted Organic Matter (EOM), selected concentrations, and biomarker and non-biomarker diagnostic ratios from the Alberta Oil Sands samples.
Figure 3. m/z 191 ion chromatograms of the saturated hydrocarbon fraction of the Alberta Oil Sands samples showing the terpane, including hopane, distributions. The grey shading highlights the key compounds used to calculate the diagnostic ratios in .
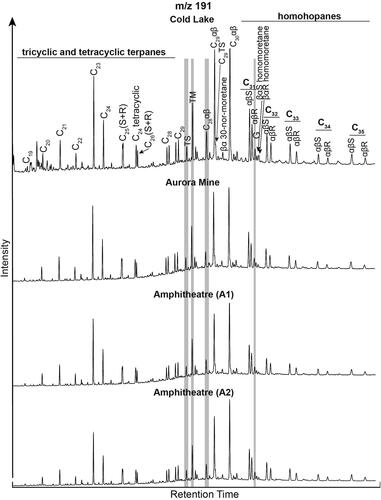
Figure 4. m/z 253 and m/z 231 ion chromatograms of the aromatic hydrocarbon fractions of the Alberta Oil Sands samples showing the aromatic steroid distributions. The grey shading highlights the key compounds used to calculate the diagnostic ratios in .
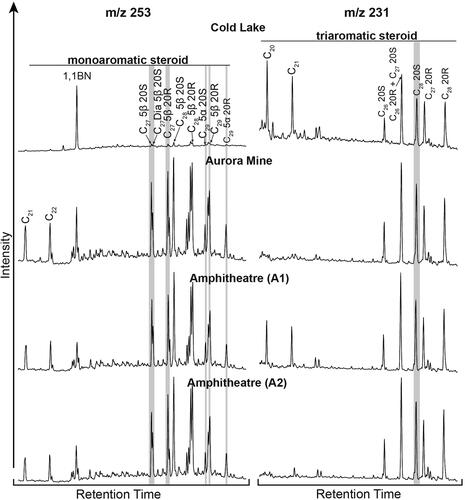
Figure 5. m/z 178, m/z 192, m/z 202, and m/z 228 ion chromatograms of the polycyclic aromatic hydrocarbons of the Alberta Oil Sands samples. The grey shading highlights the key compounds used to calculate the diagnostic ratios in .
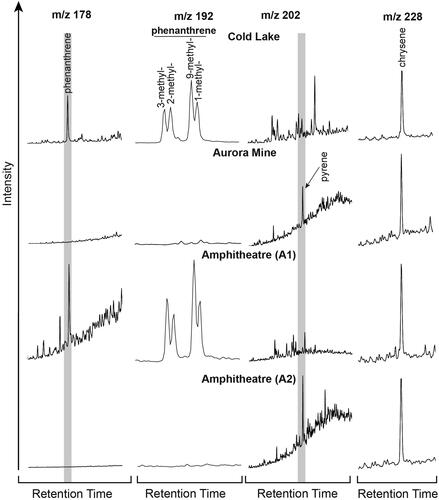
Figure 6. m/z 217 and m/z 218 ion chromatograms of the saturated hydrocarbon fractions of the surficial sediment samples showing sterane distributions. The grey shading highlights the key compounds used to calculate the diagnostic ratios in .
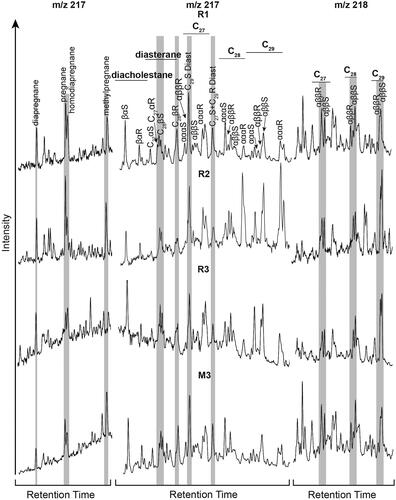
Figure 7. Ternary and cross-plot diagrams of diagnostic ratios from the sterane series using m/z 217 and 218; (a) Ternary diagram of the C27, C28, and C29 regular steranes abundance from the m/z 218 ion chromatogram. Depositional environment interpretational overlay from Integrated Geochemical Interpretation (p:IGI 3.5) software (modified after Huang and Meinschein, Citation1979). (b) Cross-plot of the Preg and DiaSt diagnostic ratios from the m/z 217 ion chromatogram. (c) Cross-plot of the St29S/R and St29I/R diagnostic ratios from the m/z 217 ion chromatogram.
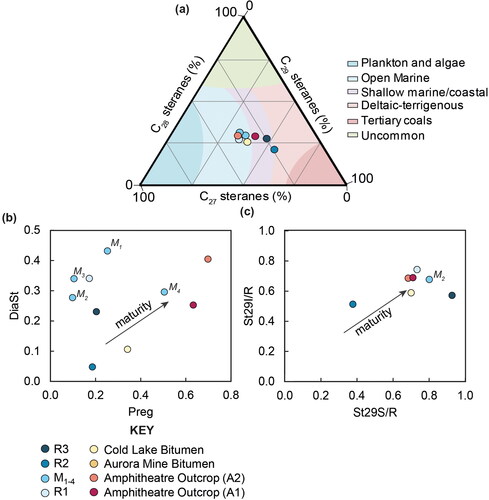
Table 4. Extracted Organic Matter (EOM), selected concentrations, and biomarker and non-biomarker diagnostic ratios from the surficial sediment samples.
Figure 8. m/z 191 ion chromatograms of the saturated hydrocarbon fraction of the surficial sediment samples showing the terpane, including hopane, distributions. The grey shading highlights the key compounds used to calculate the diagnostic ratios in .
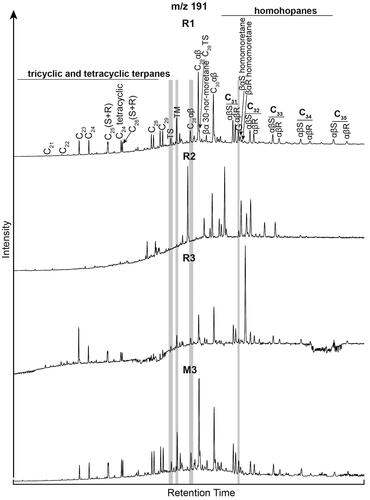
Figure 9. Cross-plot diagrams of diagnostic ratio results from the terpane series using m/z 191; (a) Cross-plot of the 35αβ/34αβ hopane and Gammacerane Index. (b) Cross-plot of the Ts/(Ts + Tm) and 29Ts/C29αβ diagnostic ratios. (c) Cross-plot of the Dia/Norm and C24Tetra/C30αβ Hopane diagnostic ratios.
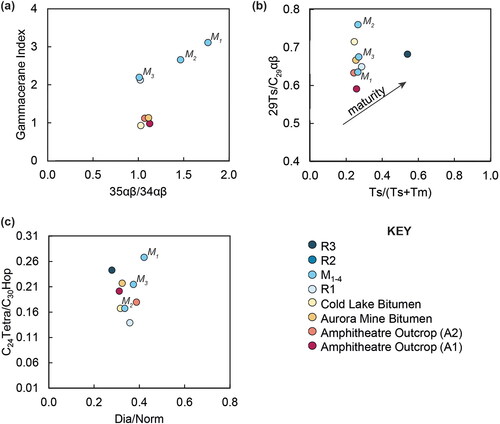
Figure 10. m/z 253 and m/z 231 ion chromatograms of the aromatic hydrocarbon fractions of the surficial sediment samples showing aromatic steroid distributions. The grey shading highlights the key compounds used to calculate the diagnostic ratios in .
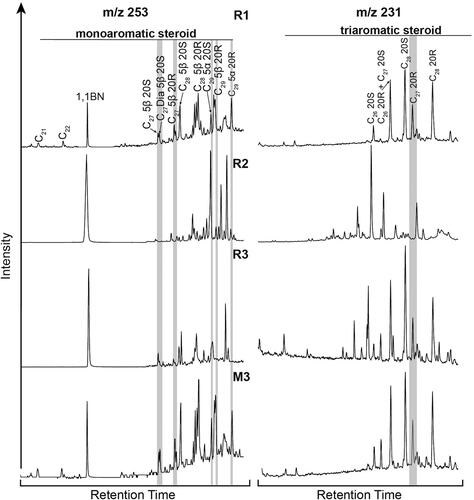
Figure 11. Cross-plot diagrams of diagnostic ratio results from the aromatic steroid series using m/z 253 and 231; (a) Cross-plot of the TAS C27/C28 (20 R) and TAS C26/C28 (20S) diagnostic ratios. (b) Cross-plot of the TAS/(TAS + MAS) and TAS C28/(TAS C28 + MAS C29) diagnostic ratios.
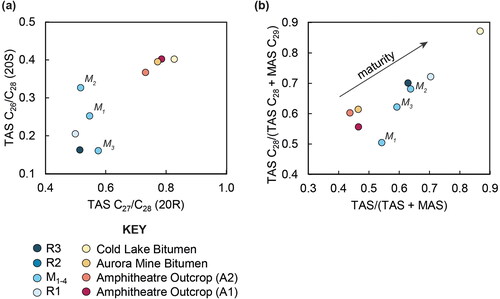
Figure 12. m/z 178, m/z 192, m/z 202, and m/z 228 ion chromatograms of the polycyclic aromatic hydrocarbons of the surficial sediment samples. The grey shading highlights the key compounds used to calculate the diagnostic ratios in .
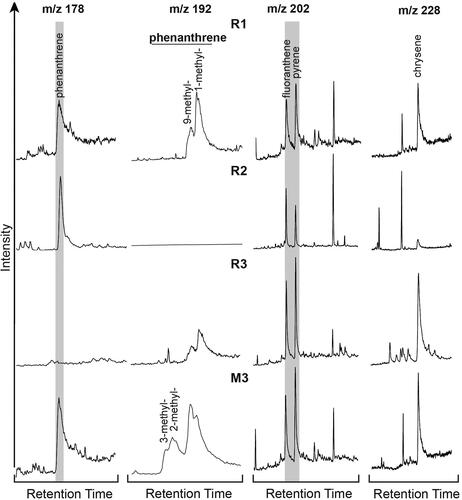
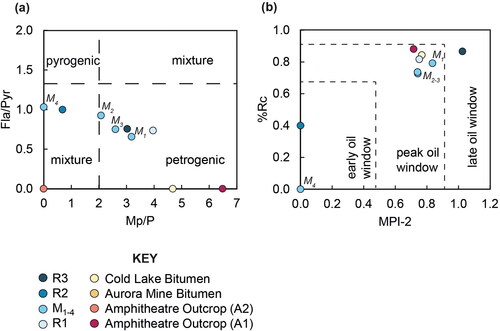
Figure 13. Cross-plots of diagnostic ratios of polycyclic aromatic hydrocarbons using m/z 178, 192, 202, and 228; (a) Mp/P and Fla/Pyr ratios with interpretation overlay adapted from Ahmed et al. (Citation2006). (b) MPI-2 and %Rc ratios with overlay from Esegbue et al. (Citation2020).
Supplemental Material
Download MS Word (2.5 MB)Data availability statement
The authors confirm that the data supporting the findings of this study are available within the article and its supplementary materials.