Figures & data
Figure 1 HAART: highly active antiretroviral therapy.
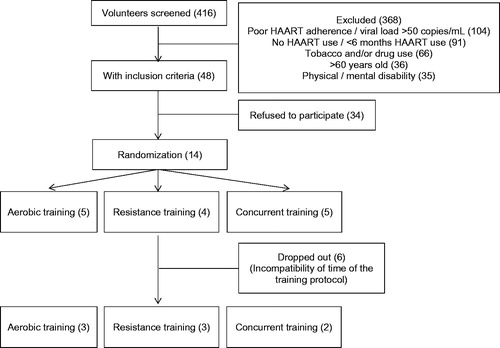
Table 1 Clinical characteristics of participants before and after training protocol
Figure 2 Effects of exercise training on oxidative stress. All subjects were considered on comparison. Diamonds represent the average values. Circle, square and triangle represent individual data before and after for aerobic, resistance and concurrent training, respectively. (A) log GSSG/GSH values and (B) log TBARS values before and after training protocol. A paired t-test was used to determine the differences between baseline and post-training values. Statistical significance was defined as p ≤ .05.
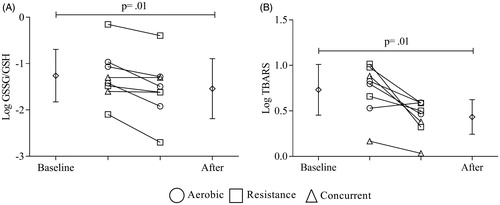
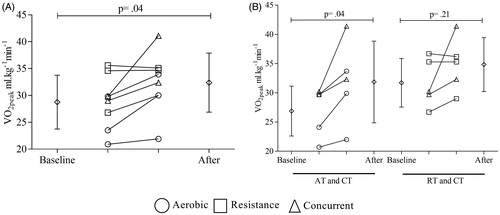
Figure 3 VO2peak values before and after training protocol. Diamonds represent the average values. Circles, squares and triangles represent individual data before and after for aerobic, resistance, and concurrent training, respectively. (A) All subjects were considered on comparison. (B) Leftmost part presents comparison between AT (aerobic training) plus CT (concurrent training) subjects whereas the rightmost partpresents comparison RT (resistance training) plus CT subjects. A paired t-test was used to determine the differences between baseline and post-training values. Statistical significance was defined as p ≤ .05.