
Figures & data
Figure 1 Description of the PROMISE 1077 BF/FF women included in the analysis. This analysis includes all women on three-drug ART during pregnancy who were randomized postpartum to continue or discontinue, as well as all women randomized to continue ART at cessation of breastfeeding (black boxes).
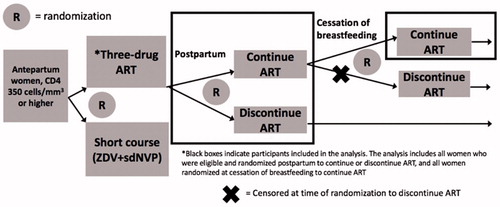
Figure 2 CONSORT flow diagram for women included in the analysis (non-enrollment reasons were reported for both the mother and the infant if the randomization occurred for the postpartum component).
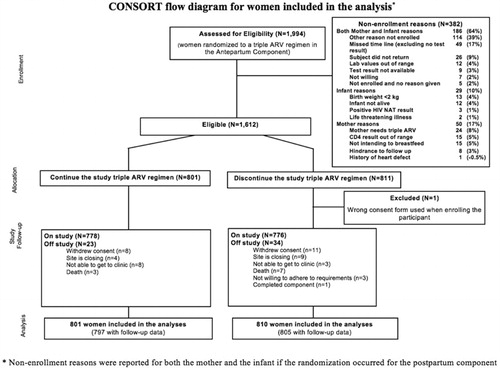
Table 1 Baseline characteristics of women in the Maternal Health Cohort of PROMISE 1077 BF/FF
Table 2 World Health Organization Clinical Stage 2 and 3 events by arm
Table 3 Laboratory adverse eventsTable Footnotea
Figure 3 CD4+ T-cell counts over time (median, 10th and 90th percentile, and proportion <350 cells/mm3). The median CD4+ T-cell counts in the continue (blue) and discontinue (red) arms are shown at each follow-up visit. The proportion with CD4+ T-cells below 350 cells/mm3 are shown across the top of the figure at each time point.
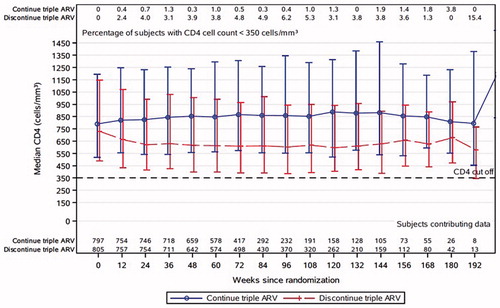
Figure 4 Survival curves for key study findings (A) primary composite endpoint; (B) WHO 2 and 3 events; (C) safety endpoint. A: Primary Composite Endpoint (HR 0.55, p = 0.37). B: WHO 2 and 3 events (HR 0.63, p = 0.01). C: Safety Endpoint (HR 0.95, p = 0.61).
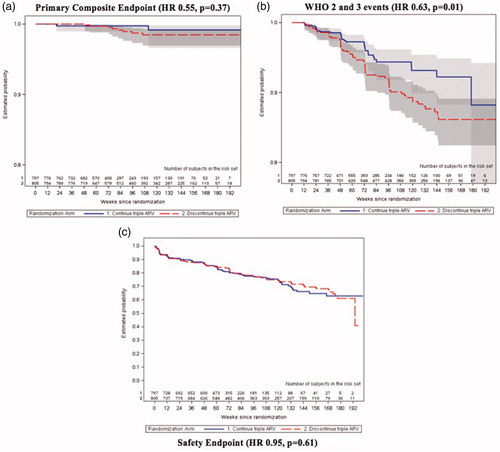
Table 4 Clinical endpoints in women in the Maternal Health Cohort of PROMISE 1077 BF/FF
Table 5 Comparison of maternal health outcomes in PROMISE BF/FF compared to PROMISE HS