Figures & data
TABLE 1. Eleven Component Vapor Phase Analysis for the Mouse Exposure Atmospheres
TABLE 2. Eleven Component Vapor Phase Analysis for the Rat Exposure Atmospheres
TABLE 3. Terminal body weights, spleen weights, and thymus weights of female B6C3F1 mice and female Crl:CD® rats exposed to Jet Fuel Kerosene by inhalation for 28 days
TABLE 4. Spleen cell phenotypes in female B6C3F1 mice exposed to Jet Fuel Kerosene by inhalation for 28 days
TABLE 5. Spleen cell phenotypes in female Crl:CD® rats exposed to Jet Fuel Kerosene by inhalation for 28 days
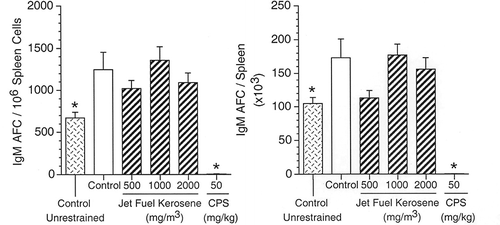
FIGURE 1. AFC response to sRBC in female B6C3F1 mice exposed to jet fuel kerosene for 28 d. On d 25 of the study, mice were immunized with 7.5 × 10⁷ sRBC by iv injection. Positive control mice received 50 mg/kg CPS daily by ip injection for 4 d prior to study termination on d 29. Left panel: AFC specific activity (IgM AFC/106 splenocytes); right panel: AFC total Spleen activity (IgM AFC/Spleen). Asterisk indicates statistically significant differences from control: *p ≤ .05.

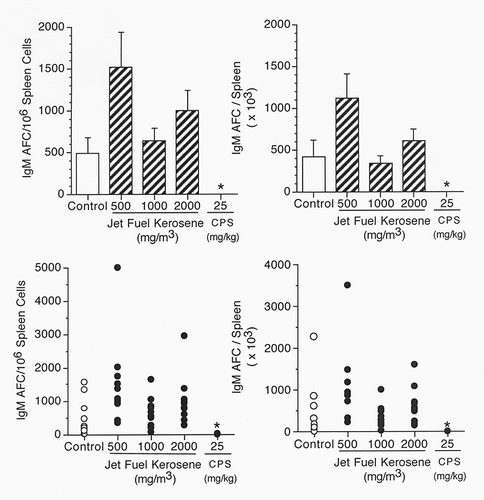
FIGURE 2. AFC response to sRBC in female Crl:CD rats exposed to jet fuel kerosene for 28 d. On d 25 of the study, rats were immunized with 2 × 10⁸ sRBC by iv injection. Positive control animals received 25 mg/kg CPS daily by ip injection for 4 d prior to study termination on d 29. The top two panels present the mean + SE for each group, while the bottom two panels present the individual responses of each animal. Left panels: AFC specific activity (IgM AFC/106 splenocytes); right panels: AFC total Spleen activity (IgM AFC/Spleen). Asterisk indicates statistically significant differences from control: *p ≤ .05.

FIGURE 3. Anti-CD3 mediated proliferation of splenocytes from female B6C3F1 mice and Crl:CD rats exposed to jet fuel kerosene for 28 d. Left panel: mice. Right panel: rats. CPS, the positive control, was administered by ip injection at either 25 mg/kg (rats) or 50 mg/kg (mice) daily on d 25–28. Spleens were harvested aseptically, and spleen cells were cultured in 96-well plates (uncoated or coated with anti-CD3 antibody) for 3 d. All cultures were labeled with [3H]thymidine (1 μCi/well) 18–24 h prior to harvest. Incorporation of [3H]thymidine into proliferating cells was the assay endpoint. Results are expressed as CPM/2 × 105 splenocytes (mice) or as CPM/5 × 105 splenocytes (rats). Asterisk indicates statistically significant differences from control: *p ≤ .05.
![FIGURE 3. Anti-CD3 mediated proliferation of splenocytes from female B6C3F1 mice and Crl:CD rats exposed to jet fuel kerosene for 28 d. Left panel: mice. Right panel: rats. CPS, the positive control, was administered by ip injection at either 25 mg/kg (rats) or 50 mg/kg (mice) daily on d 25–28. Spleens were harvested aseptically, and spleen cells were cultured in 96-well plates (uncoated or coated with anti-CD3 antibody) for 3 d. All cultures were labeled with [3H]thymidine (1 μCi/well) 18–24 h prior to harvest. Incorporation of [3H]thymidine into proliferating cells was the assay endpoint. Results are expressed as CPM/2 × 105 splenocytes (mice) or as CPM/5 × 105 splenocytes (rats). Asterisk indicates statistically significant differences from control: *p ≤ .05.](/cms/asset/00dc23f4-2c10-4d8f-8956-534919aba295/uteh_a_819307_o_f0003g.gif)
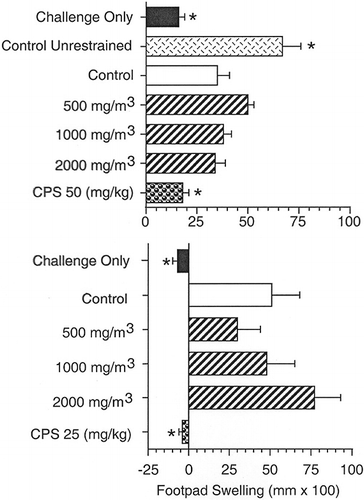
FIGURE 4. DTH response to C. albicans in female B6C3F1 mice and Crl:CD rats exposed to jet fuel kerosene for 28 d. Top panel: mice. Bottom panel: rats. Animals were immunized on exposure d 21 with formalin-fixed C. albicans organisms and challenged in the right footpad with chitosan antigen one d after the last inhalation exposure. Footpad swelling was determined 24 h postchallenge. Results are reported in terms of mm × 100. Asterisk indicates statistically significant differences from control: *p ≤ .05.

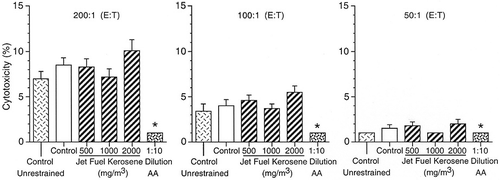
FIGURE 5. NK cell activity in female B6C3F1 mice exposed to jet fuel kerosene for 28 d. AAGM1, the positive control, was administered by iv injection 24 h prior to study termination. On d 29, spleens were harvested aseptically, and spleen cells were cultured with 51Cr-labeled YAC-1 target cells for 4 h. From each culture 100 μl of supernatant was counted in a gamma counter to assess the release of 51Cr from the target cells. Results are presented for three E:T ratios (200:1, 100:1, and 50:1) in terms of percent cytotoxicity, which was calculated as the difference between the experimental release and spontaneous release, divided by the difference between the maximum release and spontaneous release.
