Figures & data
FIGURE 1. Flow chart of indium–tin oxide production and sample collection from facility. The numbers indicate the stages in which samples were collected for analysis. “Green bodies” refers to the unsintered compound mixture before it has been fired.
TABLE 1. Summary of Physical Characteristics of Indium Compounds
FIGURE 2. Field emission scanning electron microscopy (FE-SEM) images of the collected indium compounds. Images were acquired at 10,000× magnification using a 5-kV accelerating voltage. Scale bar, 2 μm. Images of the starting materials are not included due to potential trade secret information. SITO, sintered ITO; SUITO, sintered/unsintered ITO; VD, ventilation dust; RB, reclaim by-product.
TABLE 2. Summary of the Relative Elemental Composition and Indium Species on Particle Surfaces as Determined by X-Ray Photoelectron Spectroscopy High-Resolution Analysis
FIGURE 3. Electron spin resonance measurement of •OH radicals following reaction of indium compounds with H2O2 or cells. (A) A mixture of indium compounds (10 mg/ml), H2O2 (1 mM), and spin trap DMPO (100 mM) in PBS was incubated in test tubes for 3 min at room temperature, and scanned via ESR. Negative controls contained the mixture without compounds (PBS). Signal intensity (peak height) is used to measure the relative amount of hydroxyl radicals. Error bars represent the mean ± SD. Asterisk indicates significant at p < .05 compared to all other treatments. Inset: representative control and VD spectra. (B) The same as in (A), except without H2O2 but including RAW 264.7 cells (2 × 10⁶). Samples were incubated at 37°C for 5 min prior to measurements. Error bars represent the mean ± SD (n = 3). Asterisk indicates significant at p < .05 compared to untreated cells (PBS).
FIGURE 4. Intracellular ROS production in cells following treatment with indium compounds. (A) RAW 264.7 cells were pretreated with DCFH-DA, exposed to 50 μg/ml indium compounds or 1 mM chromium(VI) as a positive control, and plates were read each hour to measure intracellular ROS. Error bars represent the mean ± SD (n = 6). Asterisk indicates significant at p < .05 compared to control cells (PBS) at that time point. (B) A comet assay was used to examine DNA damage from intracellular ROS. Cells were treated with 50 μg/ml indium compounds or 1 mM chromium(VI) for 3 h, washed and scraped into PBS, added to glass slides with agarose, then lysed and subjected to electrophoresis. SYBR green was added to stain double-stranded DNA. Images were acquired using fluorescence microscopy and a 40× objective. Cell comets were measured by comparing the corrected nuclear region fluorescence to the corrected total cell fluorescence. This was converted to a percentage to indicate DNA damage. Error bars represent the mean ± SD. Asterisk indicates significant at p < .05 compared to untreated cells (PBS). (C) Representative comets. RB; reclaim by-product, Cr(VI); chromium(VI).
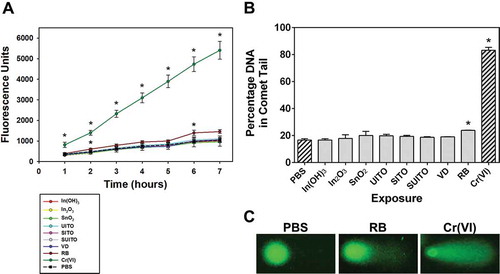
FIGURE 5. Indium compounds associate with RAW 264.7 cells over a time course of treatment. A. Representative images for some of the cell-particle interactions over a 3-h time course. RAW cells were grown on coverslips and treated with 50 μg/ml indium compounds for 5 min, 1 h, or 3 h. Cells were washed three times in PBS, fixed, and mounted onto ultraclean glass slides with Fluoromount G. Experiments were performed in duplicate, and cells were imaged using a CytoViva enhanced dark-field microscopy system and a 60× objective to attain images of high-contrast particles (bright spots) against a dark background. (B) At least 50 cells were counted from 3 fields for each condition and time point. Any particles in the PBS control samples are believed to be silica, due to residual glass pieces on the coverslips. Error bars represent the mean ± SD. Asterisk indicates significant at p < .05 compared to PBS controls; Δ, significant at p < .05 compared to the corresponding 5-min exposure for that treatment. Scale bar, 10 μm.
FIGURE 6. Indium compounds reduce cell viability. (A, B) RAW 264.7 cells were treated with indium compounds or Min-U-sil (Si) and incubated at 37° C for 24 h (A) or 48 h (B). MTT was added to wells for the last 4 h, and absorbance was read at 570 nm. All values were normalized to PBS-treated control wells, which were calculated to represent 100% viability. (C, D) The same as in (A) and (B), except with BEAS-2B cells. Error bars represent the mean ± SD (n = 6). Asterisk indicates significant at p < .05 compared to PBS controls.
FIGURE 7. Caspase activation occurs following indium compound exposure in RAW 264.7 cells but not in BEAS-2B cells. (A) RAW 264.7 cells were treated with indium compounds or Min-U-Sil (Si) for 24 h, 5 μM Caspase-3/7 Green Detection substrate was added, and plates were read at 500 nm excitation/530 nm emission. (B) The same as in (A), except BEAS-2B cells were treated with 10 μM Caspase-3/7 Green Detection substrate. Error bars represent the mean ± SD (n = 6). Asterisk indicates significant at p < .05 compared to PBS controls.