Figures & data
FIGURE 1. Examples of experimental D. magna fed maize leaves. Maize leaf-particles can be seen in the gut of animals. a) D. magna bearing subitaneous eggs. b) D. magna bearing an immature ephippium (protective structure enclosing two dormant eggs). Bars have 2 mm.
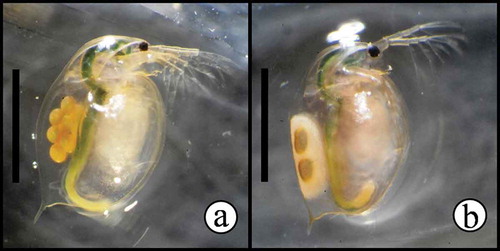
FIGURE 2. Immuno-detection of MON810’s rCry1Ab. MagicMark™ XP Western Protein Standard (M), positive control (PC - Cry1Ab purified from B. thuringiensis), the three non-transgenic near-isoline plants (NM1, NM2 and NM3) and the three MON810 Bt-maize plants (GM1, GM2 and GM3). Strong immunoreactive bands of ca. 69 kDa and 34 KDa can be distinguished in the GM-maize samples.
FIGURE 3. Body size of D. magna fed Bt-maize (GM) and near-isogenic maize (NM) leaves. Shaded bands indicate 95% confidence intervals.
FIGURE 4. Stage fecundity of D. magna fed Bt-maize (GM) and near-isogenic maize (NM) leaves. Shaded bands indicate 95% confidence intervals.
FIGURE 5. Cumulative fecundity of D. magna fed Bt-maize (GM) and near-isogenic maize (NM) leaves. Shaded bands indicate 95% confidence intervals.
FIGURE 6. Ephipum production in D. magna. a) Total ephippia produced in the Daphnia bioassay, for experimental D. magna fed Bt-maize (GM) and near-isogenic maize (NM) leaves. b) Probability of ephippium production among experimental D. magna fed Bt-maize (GM) and near-isogenic maize (NM) leaves. Error bars indicate 95% confidence intervals.