
Figures & data
Figure 1. Timeline of the experiment. Left-hand axis represents the days of experiment (T) with key experimental and sampling events annotated (black font); right-hand axis represents the age of the capelin early life stages in days post fertilization (dpf), with key embryo developmental stages (violet font).
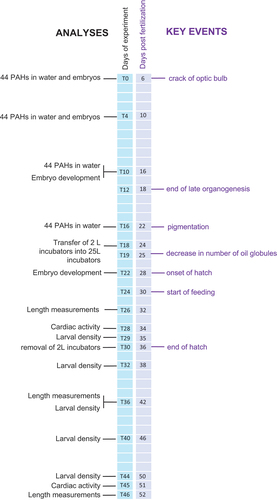
Figure 2. (a) Sum of 44 PAHs (μg/L) in the effluent water from the gravel columns (no replication) at 0, 4, 10, and 18 d of exposure, corresponding to embryos at 6, 10, 16, and 24 dpf, respectively. (b) Sum of 44 PAHs (ng/egg) accumulated in 10 dpf embryos after 4 d of exposure. Dots represent incubator-specific levels, and the line connects the overall means.
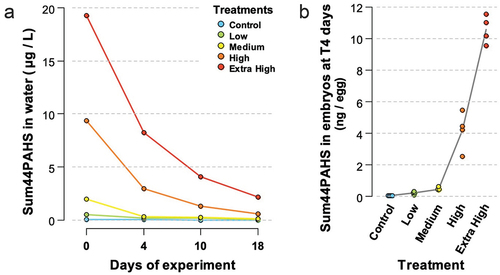
Figure 3. Concentration of 44 PAHs (pg/egg) in embryos of the Control, Low, Medium, High, and Extra High groups following 4 d of exposure. The sum of 44 PAH concentrations (ng/egg wet weight) is listed for each treatment group. Parent compounds are indicated with full name, while alkylated homologs are indicated as C1-, C2-, C3-, and C4-.
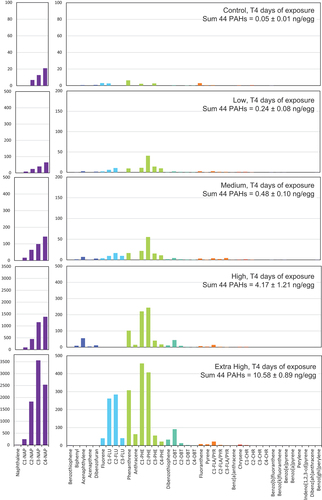
Figure 4. (a) Representative photograph of a normally (top) and abnormally (bottom) developed embryo at 28 dpf. (b) Percentage abnormally developed embryos at 16 dpf and 28 dpf, corresponding to 10 and 22 d of experiment. The means of the four incubators for each treatment are plotted as dots and the dashed line connects the overall means. n = 48 ± 20 larvae were assessed per incubator. The size of the dots is proportional to the specific n per incubator (range 17–82, and 35–97 eggs counted per incubator at 16 and 28 dpf, respectively).
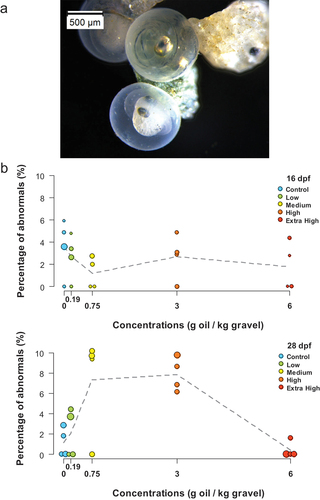
Figure 5. Larval density (larvae per liter) from 35 dpf until 50 dpf, corresponding to 29–44 d of experiment. The means of the four incubators for each treatment, normalized to incubator-specific densities at 35 dpf, are plotted as dots, and the line connects the overall means.
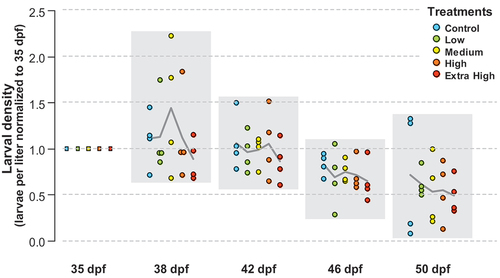
Figure 6. Length (in mm) of larvae (n > 114 per treatment) sampled at 32, 42 and 52 dpf, corresponding to 26, 36 and 46 d of experiment. Box plots represent the median (line), 25–75% percentiles (box), non-outlier range (whisker), and outliers (circles).
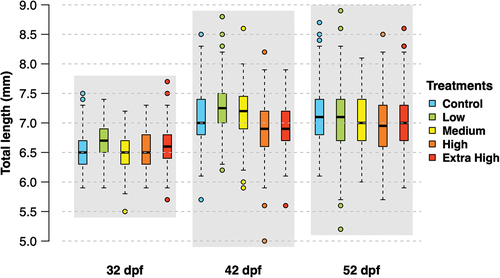
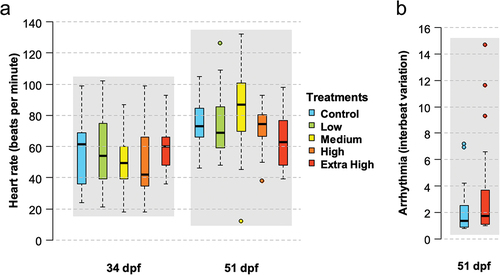
Figure 7. (a) Cardiac activity (heart rate in beats per minute) measured on larvae (n = 20 per treatment) at 34 and 51 dpf. (b) Arrhythmia (interbeat variation) measured on larvae (n = 20 per treatment) in the Control and Extra High treatment groups. Box plots represent the median (line), 25–75% percentiles (box), non-outlier range (whisker) and outliers (circles).
Supplemental Material
Download MS Word (10 MB)Data availability statement
The data that support the findings of this study are available in DataverseNO with the DOI identifier https://doi.org/10.18710/CHHSXW.