
Figures & data
Figure 1. CONSORT flow diagram.
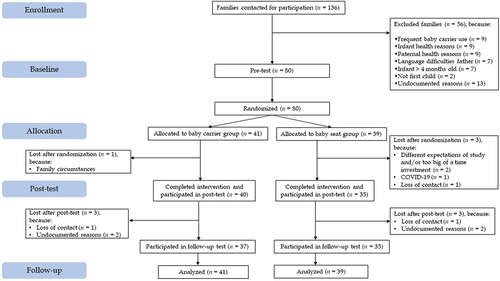
Table 1. Descriptive statistics.
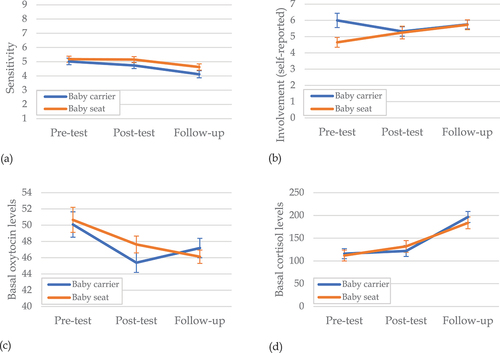
Figure 2. Development of (a) sensitivity, (b) involvement, (c) oxytocin levels, and (d) cortisol levels over time, for the baby carrier and baby seat groups. Error bars display standard errors.
Supplemental material