Figures & data
Table 1. Summary of sample demographics in studies 1 and 2.
Table 2. Summary of Coded Responses for Ingroups Targeted by Campaign Rhetoric in Studies 1 and 2.
Table 3. Study 1 – Bivariate correlations, Means, and Standard Deviations of Main Study Variables Including Political Orientation.
Table 4. Study 1: Results of Linear Regression Analyses (standardized betas and p-values) Predicting Core Outcome Variables from Condition, Feeling Targeted, and their Interaction.
Table 5. Study 2 – Bivariate correlations, Means, and Standard Deviations of Main Study Variables Including Political Orientation.
Table 6. Study 2: Results of Linear Regression Analyses (standardized betas and p-values) Predicting Core Outcome Variables from.
Figure 1. Study 2 interaction of condition and feeling targeted predicting social fit.
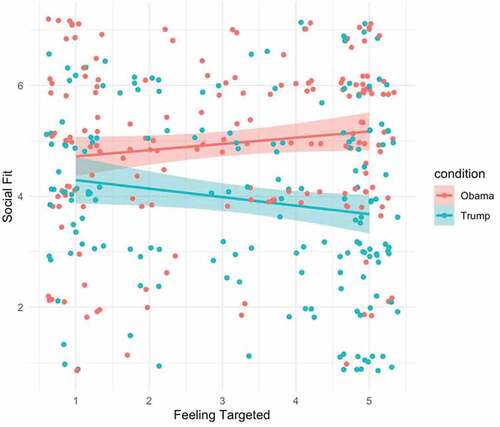
Table 7. Summary of Sample Demographics in Study 3.
Table 8. Bivariate correlations, Means, and Standard Deviations of Main Study Variables Including Political Orientation in the Combined Study 3 Sample. Reported d-scores are from models without covariates.
Table 9. Results of Linear Regression Analyses (standardized betas and p-values) Predicting Core Outcome Variables from Time.