
Figures & data
Table 1. Sociodemographic Characteristics of the Sample (N = 1,020).
Figure 1. Latent Class Profiles of Complex PTSD and Dissociation.
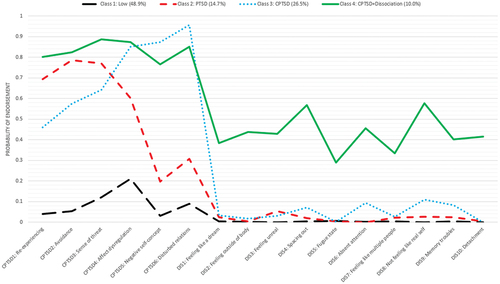
Table 2. Latent Class Analysis Fit Statistics for Complex PTSD and Dissociation.
Table 3. Correlates of Class Membership.
Table 4. Tests of Mean Differences Across Latent Classes (N = 1,020).