
Figures & data
Figure 1. Distribution of threshold values by type of item: simple (left) and complex (right) MC.
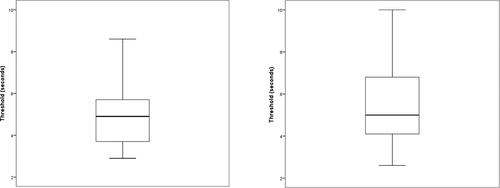
Figure 2: Boxplots for item accuracies by type of behavior and type of item: simple (left) and complex (right) MC.
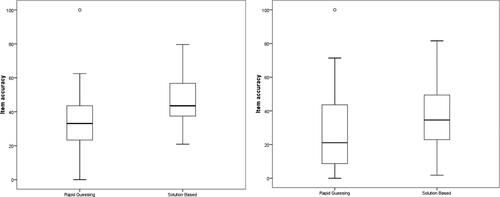
Figure 3. Scatterplots for the accuracy of rapid-guessing (RG) versus solution-based behavior (SB) for simple (left) and complex (right) MC items under sample size and key conditions.
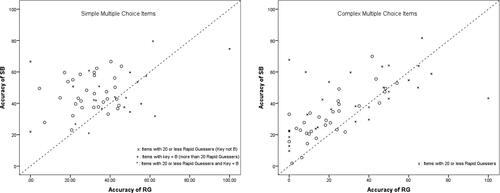
Figure 4. Histogram for the number of students engaging in solution-based behavior on the 114 MC items.
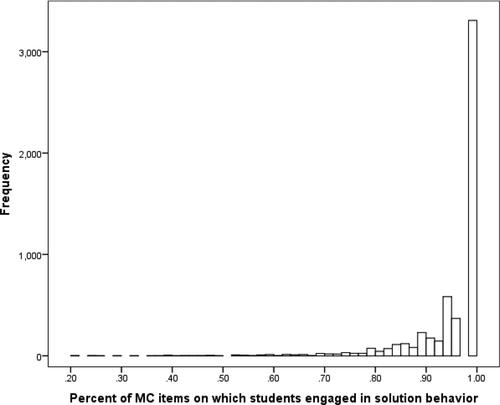
Table 1. Descriptive statistics for threshold and number of examinees by type of response behavior.
Table 2. Descriptive statistics for accuracy level by type of response behavior.