Figures & data
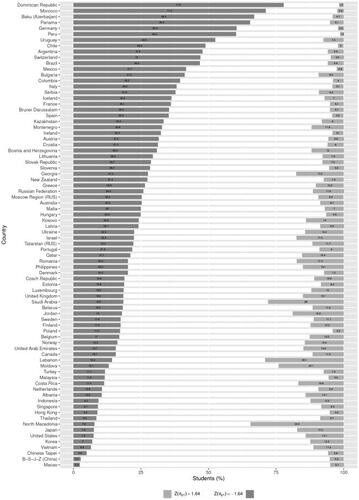
Figure 1. Country-by-item nonresponse rates on the PISA 2018 student background questionnaire.
Note. Nonresponse rates were calculated per country by item as the ratio of the number of students who did not respond to the item to the number of students who were administered said item. Countries are arranged in descending order of their mean item nonresponse rates.
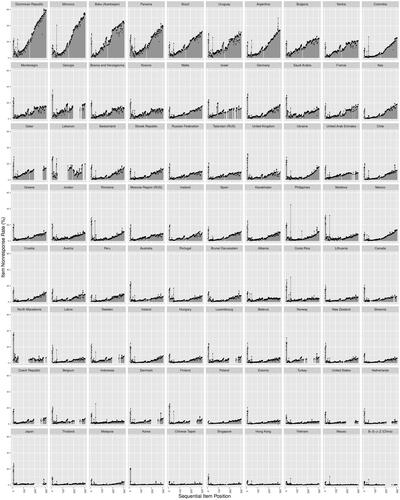
Figure 2. Average item nonresponse trend across students.
Note. The figure displays the probabilities of nonresponse for each item of the questionnaire, predicted based on the cross-classified mixed effects models’ parameter estimates and
(EquationEquation 1
(1)
(1) ) for each individual student-by-item combination within each country. The probabilities were first aggregated across students per item within each country and then across countries. The probabilities are arranged in the sequence as the items appear on the questionnaire. The breaks in the curve represent the items that were free from nonresponse by design (see subsection Measures).
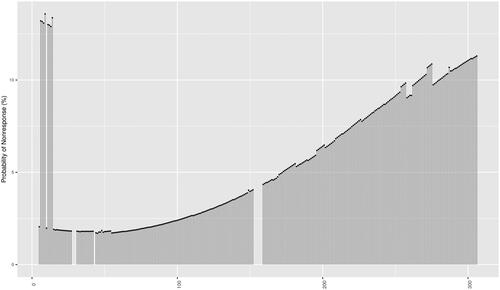
Figure 3. Between-country differences in slope of the item nonresponse trend for the average student.
Note. The parameter represented is the random-effects slope μ1 in the cross-classified mixed effects models (EquationEquation 1(1)
(1) ). The slope is expressed in logits, and one unit on its corresponding predictor—the sequential item position—counts 50 items. Positive and negative μ1 parameter values correspond to higher and lower odds of item nonresponse as students progress through the questionnaire, respectively. At the grey dashed line, neither outcome (nonresponse or response) is more likely than the other. The pooled estimate
obtained via the multivariate random effects meta-analysis of fixed-effects parameters is presented at the bottom of the graph. The black diamond shape corresponds to the 95% confidence interval around the pooled estimate. The bars around it map the corresponding prediction interval to indicate cross-country dispersion around the pooled estimate.
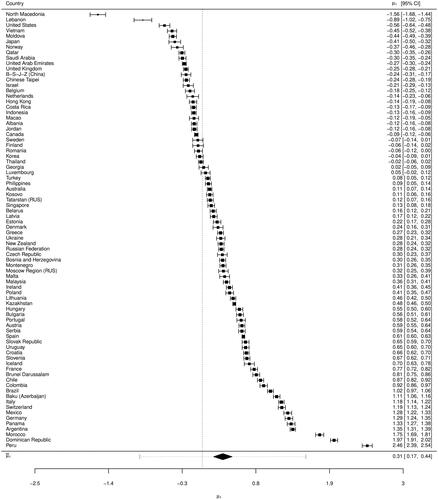
Figure 4. Country-wise average item nonresponse trends across students.
Note. The figure displays the average probabilities of nonresponse for each questionnaire item in each country. The probabilities of nonresponse were predicted based on the cross-classified mixed effects models’ parameters and
(EquationEquation 1
(1)
(1) ) for each individual student-by-item combination within each country. The probabilities were aggregated across students per item within each country. The probabilities are arranged in the sequence as the items appear on the questionnaire. The breaks in the curve represent the items that were free from nonresponse by design (see subsection Measures). The countries are arranged in ascending order of the slope μ1 for the average student ().
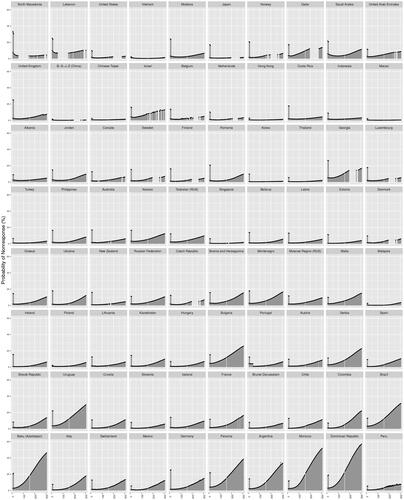
Figure 5. Individual students’ item nonresponse propensity trends.
Note. For each country, the grey lines connect the individual students’ item nonresponse propensities on the first item of the questionnaire (i.e., ) to the item nonresponse propensity on the last item of the questionnaire (i.e.,
). The black lines are the corresponding item nonresponse propensity trends for the country’s average student (i.e.,
).
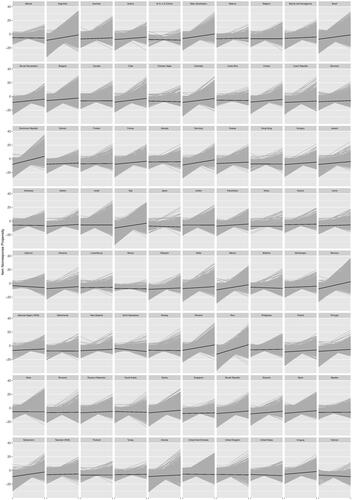
Figure 6. Country-specific variances of and correlations between the student-specific intercepts and slopes of the nonresponse propensity trends.
Note. The variances and
are presented on the logit scale and correspond to the variances of the cross-classified mixed effects models random-effects parameters
and
, respectively (EquationEquation 1
(1)
(1) ). The countries are arranged in ascending order of the slope μ1 for the average student ().
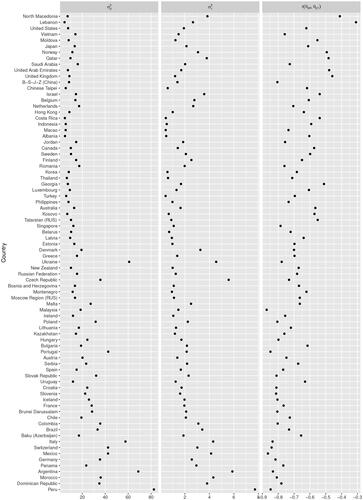
Figure A1. Country-wise parameter estimates μ0 of the cross-classified mixed effects models.
Note. The parameter estimates are presented on the logit scale and correspond to the μ0 parameters of the cross-classified mixed effects models (EquationEquation 1(1)
(1) ). Positive and negative μ0 parameter values correspond to higher and lower odds of item nonresponse as students begin the questionnaire, respectively. The pooled estimate obtained via the multivariate random effects meta-analysis (
) is presented at the bottom of the graph. The black diamond shape corresponds to the 95% confidence interval around the pooled average, and the bars around it map the corresponding prediction interval as an indication of dispersion around the pooled average.
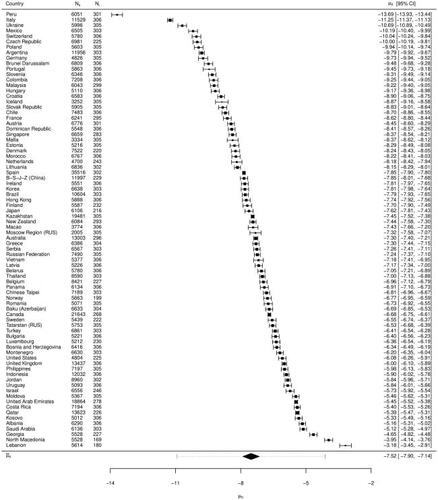
Figure A2. Country-wise parameter estimates β of the cross-classified mixed effects models.
Note. The parameter estimates are presented on the logit scale and correspond to the β parameter estimates of the cross-classified mixed effects models (EquationEquation 1(1)
(1) ). The scales ST006 and ST008 included eight items that inquired about students’ parents’ qualifications (i.e., scale ST006: Does your mother have any of the following qualifications? ST006Q01TA < ISCED level 6>, ST006Q02TA < ISCED level 5A> (theoretically oriented tertiary and post-graduate), ST006Q03TA < ISCED level 5B> (vocational tertiary), ST006Q04TA < ISCED level 4> (non-tertiary post-secondary)). A ‘yes’ or ‘no’ response had to be selected for each item. Positive and negative β parameter values correspond to higher and lower odds of item nonresponse on an average item of the ST006 and ST008 scales, respectively, compared to the odds of item nonresponse on the other items with a similar position on the questionnaire. The pooled estimate obtained via the multivariate random effects meta-analysis (
) is presented at the bottom of the graph. The black diamond shape corresponds to the 95% confidence interval around the pooled average, and the bars around it map the corresponding prediction interval as an indication of dispersion around the pooled average.
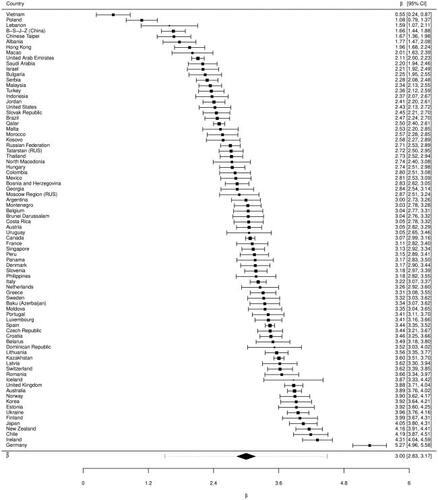
Figure B1. Association between the average student’s intercept μ0 and the sequential item position slope μ1.
Note. The figure shows the association between two sets of parameters across 80 countries, μ0 (i.e., the average student’s baseline nonresponse propensity) and μ1 (i.e., the average student’s item nonresponse propensity as a function of sequential item position; EquationEquation 1(1)
(1) ).
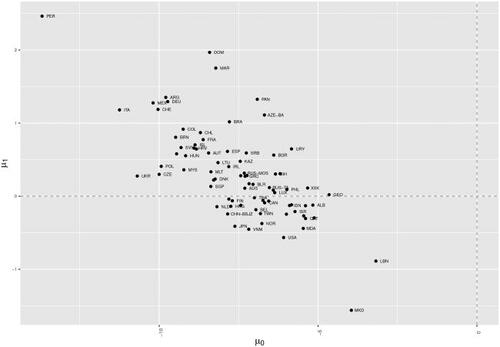
Figure C1. Percentages of students with significantly positive and negative individual sequential item position slopes.
Note. Percentages are calculated as proportions of the total countries’ students’ samples that were identified by one-tailed Wald tests as having significantly positive, stable, and significantly negative individual sequential position slopes, , and
, respectively. The countries are arranged in descending order of the percentage of students with a significantly positive sequential position slope (
).