
Figures & data
Figure 1. Process during experiment.
Table 1. Allocation of Participants During the Negotiation Game.
Table 2. Descriptive Statistics by Experimental Condition.
Figure 2. Contributions by experimental condition (left side), and by study type (right side).
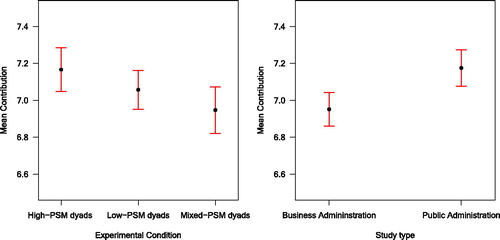
Figure 3. Development of contributions over time during the experiment (left = raw data, right = smoothing applied).
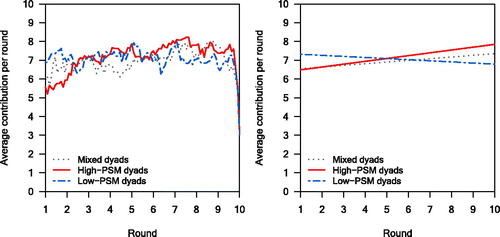
Table 3. Hierarchical Tobit Estimates on Contributions During the Experiment (negotiation dyads as random effects.).