Figures & data
Table 1. A table showing soil mixtures and a range of moisture and oil content used for the experiments.
Figure 1. Distinctive spectra of various mixtures of sand, clay, water and oil. Absorption peak at 1720 nm distinguishes oil-contaminated vs uncontaminated soil samples. Spectral signatures with broad peaks around 1400 nm and 1900 nm are indicative of water, while sharp peaks at 1400 nm characterize soil samples.
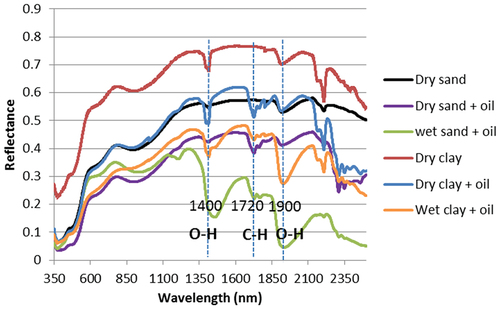
Figure 2. (a) Calibration plot showing inverse relationship between Oil Index vs oil content for dry SAND100. (b) calibration plot for dry SAND90. (c) A polynomial regression plot of Oil Index vs oil content in dry SAND100 showing good correlation. (d) A plot showing good correlation for Oil Index vs oil content in SAND90 (e) A good correlation for Oil Index vs oil content in wet SAND100 (f) A plot showing poor correlation for Oil Index vs oil content in SAND90.
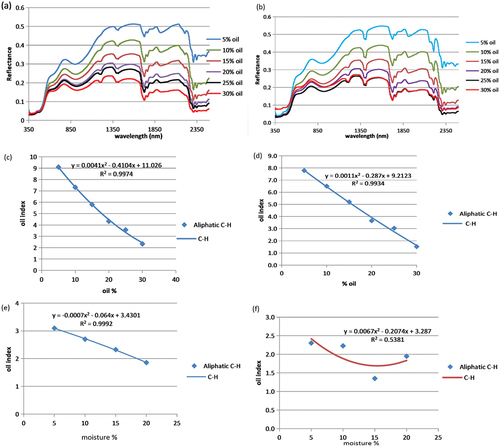
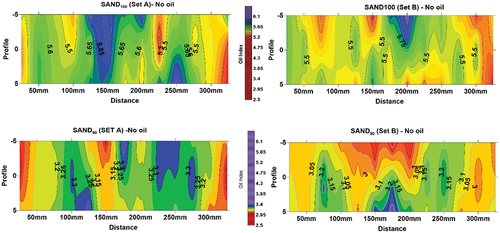
Figure 3. (a) Slice-map showing a 3D outline of oil contaminant plume in SAND100, delineated area (white dotted line). Average Oil Index = 7.7. (b)Slice-map of wet SAND100. Spatial variation along slice surfaces may be due to relative displacement of water and oil. Note the lower index values at the bottom slice, indicating fluid accumulation.
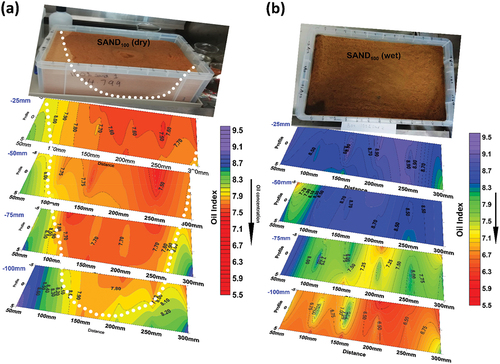
Figure 4. (a) Slice-map of dry SAND90 sand showing the spatial distribution of oil in the subsurface. The white dotted lines on the first and third slice delineate oil pool formed on the surface in the picture above. Average Oil Index = 6.6. Blue arrows indicate possible oil accumulation in minor fissures. (b) Slice-map of wet SAND90 soil showing spatial distribution of oil (and water). Note the reduced Oil Index values and accumulated fluids toward the bottom.
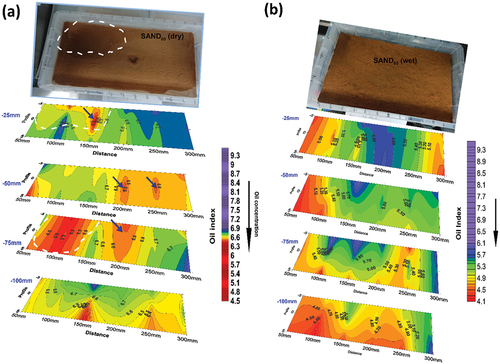
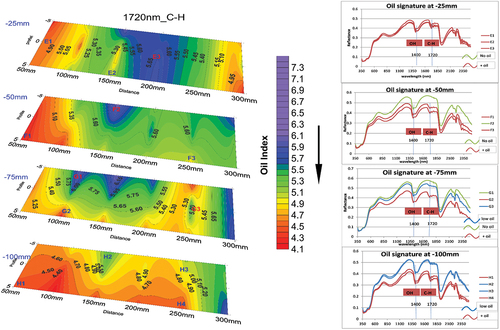
Figure 5. Slice map of wet SAND90 mixture showing points where spectral visualization were done at various depths. Oil peak occur at 1720 nm. Brown spectra (F1, F3, G2, H1, H4) are indicative of relatively high oil concentration, blue spectra (G3, H2, H3) indicate low concentration while green spectra (F2, G1) show areas where water preferentially accumulated relative to oil.