Figures & data
Figure 1. The precision loss while computing the SCV.
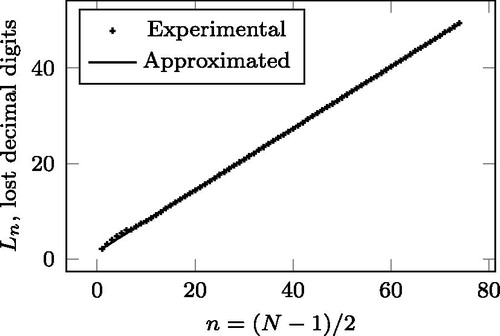
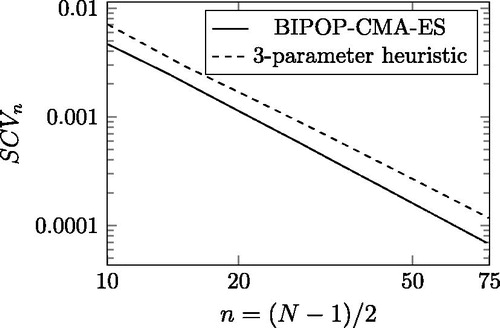
Figure 2. The minimal and the heuristic SCV as a function of order n in log-log scale.
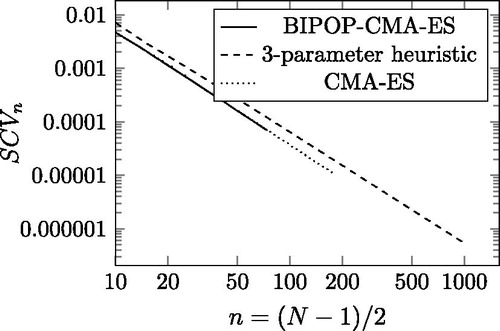
Figure 3. The minimal SCV of the exponential cosine-square functions as the function of n in log-log scale.
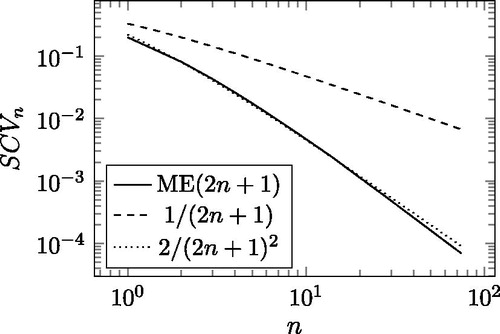
Figure 4. The function with logarithmic y axis.
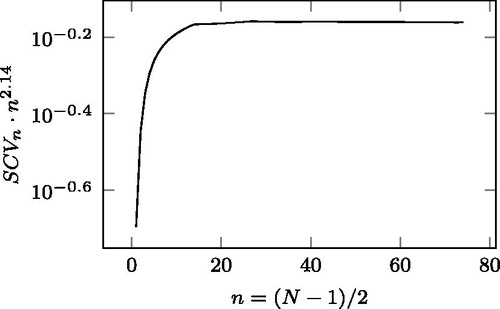
Figure 5. The ω parameter providing the minimal SCV in lin-lin and log-log scales.
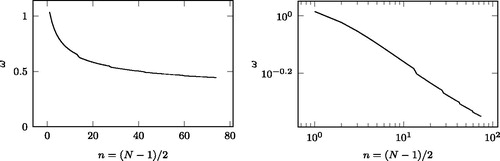
Figure 6. The location of the parameters providing the minimal SCV.
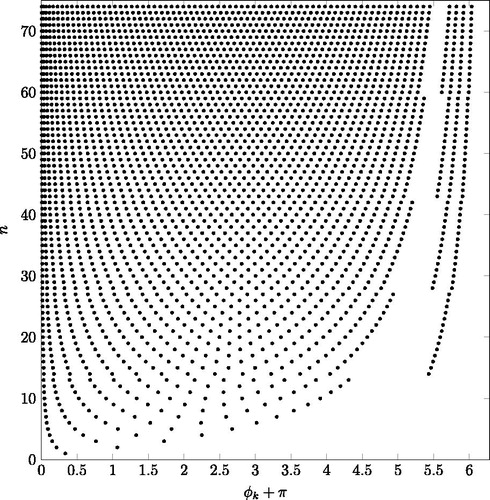
Figure 7. with ω = 1, n = 3,
for
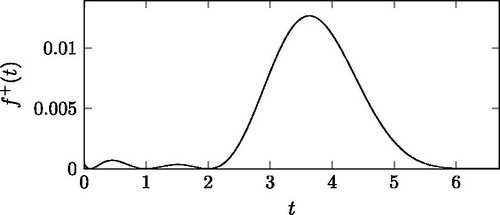
Figure 8. The initial part of (without exponential attenuation), with ω = 1, n = 3,
for
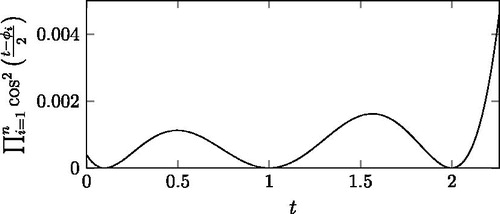
Figure 9. The spike and the zeros of
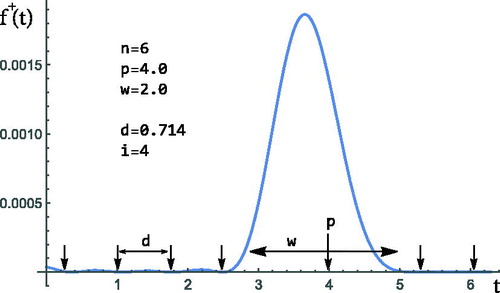
Figure 10. The minimal and the heuristic SCV as a function of order n in log-log scale.