Figures & data
Figure 1. An undirected non-bipartite compatibility graph.
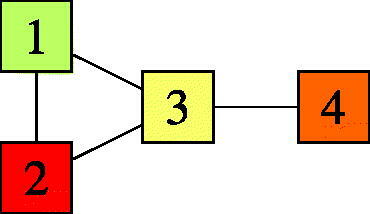
Figure 2. Unmatched items are ordered in the buffer from the oldest item on the left to the newest on the right. In particular, in the state depicted in the picture, the oldest item is of class 4 and the newest is of class 1. With the compatibility graph of , if a class-2 item arrives while the system is in this state, this item scans the buffer from left to right until it finds a compatible item, and is therefore matched with the oldest class-1 item. The new system state after this transition is
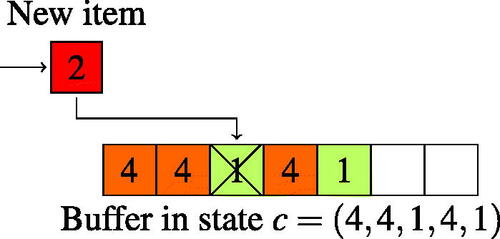
Figure 3. Toy examples with N = 9 classes.
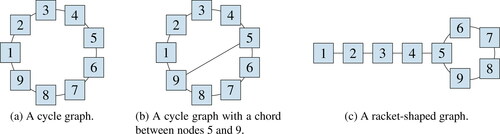
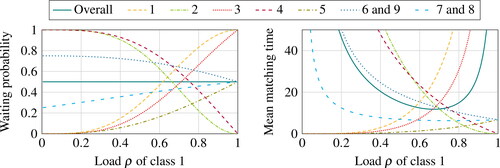
Figure 4. Performance (overall and per class) in a cycle with N = 9 classes.
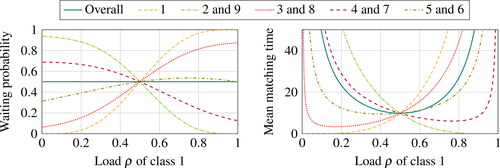
Figure 5. Performance (overall and per class) in a cycle with N = 9 classes supplemented with a chord between classes 5 and 9.
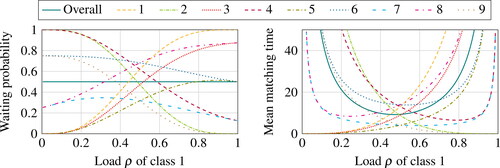
Figure 6. Performance (overall and per class) in the racket-shaped graph with N = 9 classes shown in .