Figures & data
Figure 1. Conceptual framework of the study.
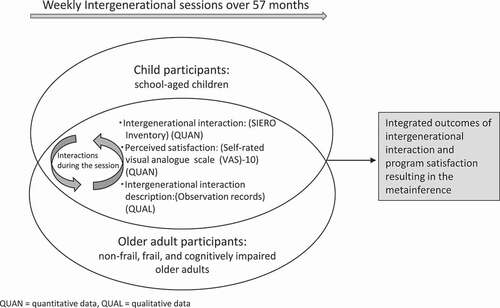
Figure 2. Procedural diagram of the prospective longitudinal mixed methods parallel convergent design of the study.
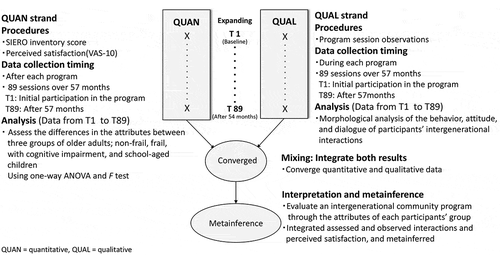
Table 1. Characteristics of participants according to generation
Table 2. Observed and analyzed program sessions
Table 3. Interaction and satisfaction score
Figure 3. Distribution of interactions (SIERO) and program satisfaction (VAS-10) scores by program and participant group.
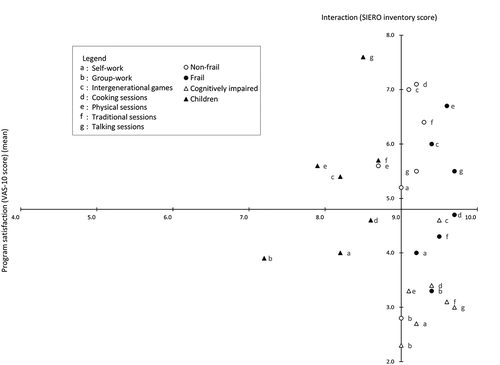
Table 4. Intergenerational session observation morpheme results
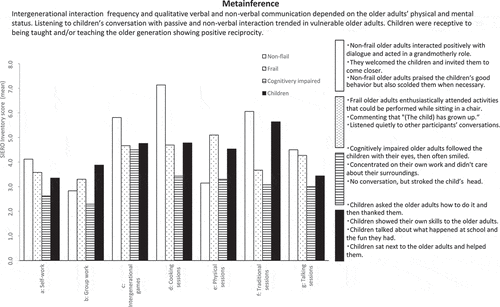
Figure 4. Joint display of mean SIERO scores in each session by group.