
Figures & data
Fig. 1. Toroidal displacements under low iota 2.5-T EM loads in meters. (Last reference regime commissioned on June 28, 2018. Finite Element GM version 6.04: 5 × 1.4-M nodes.)
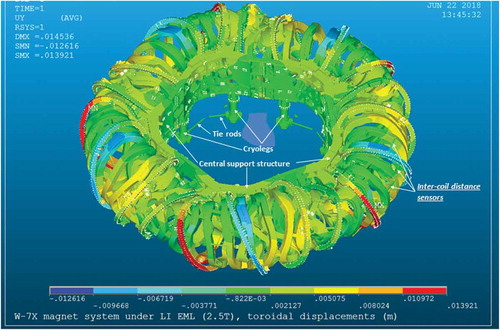
TABLE I Operation Phases, Achievements, and Future Goals
Fig. 2. Fragment of MS global FE model with indication of main support types.Citation7
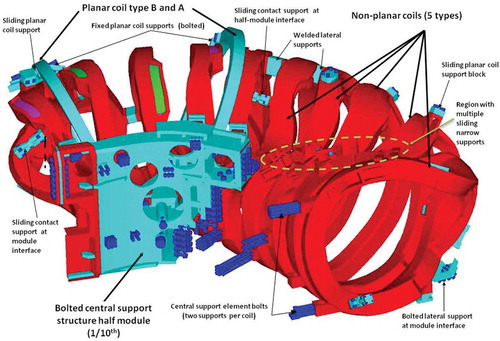
Fig. 3. Comparison between numerical prediction and measurements for coil mutual displacements between NPC type 5 coils and PLC type B during ramping up low iota coil currents. (a) Finite element prediction, (b) typical monitoring supervision results, and (c) post processing of monitoring results to show average signal and error bars.
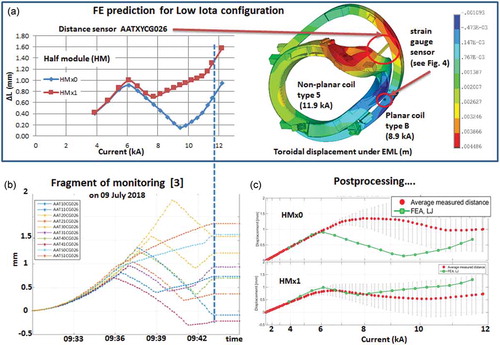
Fig. 4. Finite element prediction for PLC type B coil case von Mises stress (recalculated from strain gauges rosetteCitation4) during ramping up low iota coil currents. The location of the sensor is shown in ; the two lines represent two half-modules similar to .
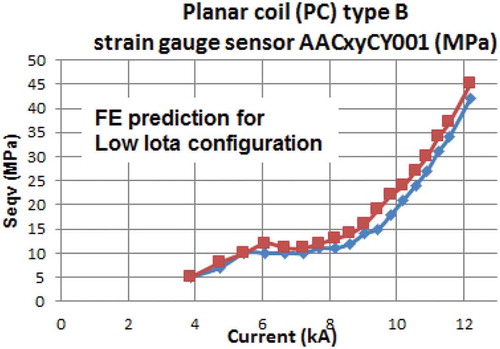
Fig. 5. Typical example of FE model of welded lateral support.
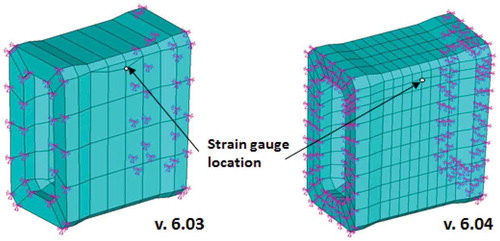
TABLE II Types of Analyses for OP1.2a and OP1.2b
Fig. 6. Schematic view of linearization.
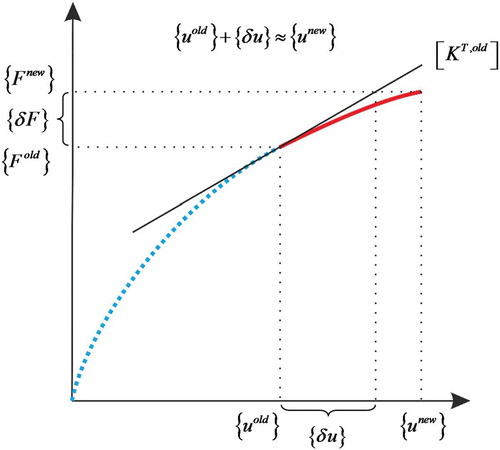
Fig. 7. Filtering of configuration proposals from physicists after improvements following OP1.1 and OP1.2a.
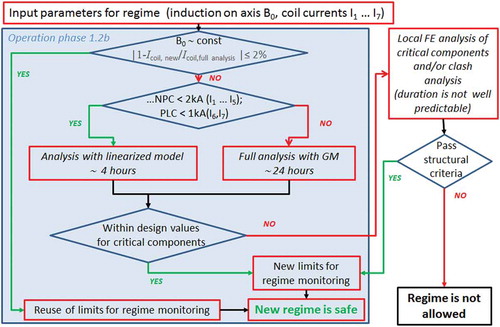
Fig. 8. Example of MS structural limitations for 2.5-T regimes proposed for NBI operation with minimum fast ion impact on in-vessel components.Citation16
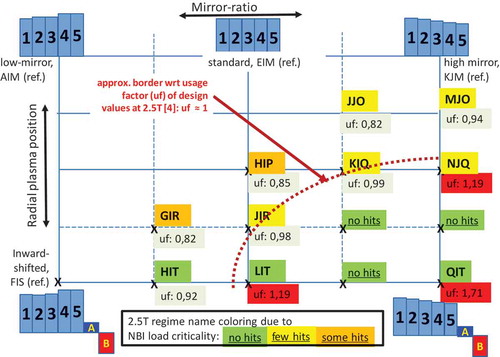
TABLE III Fast Discharge Events from High Coil Current Levels with Their Consequences