Figures & data
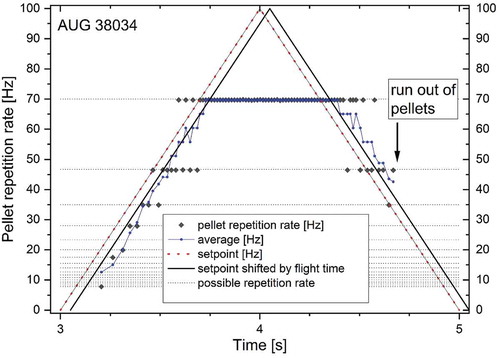
Fig. 1. Pellet injection system composed of cryostat unit, centrifuge launcher, looping-shaped guiding tube, and vacuum system located in Seg 5 of the ASDEX Upgrade vessel
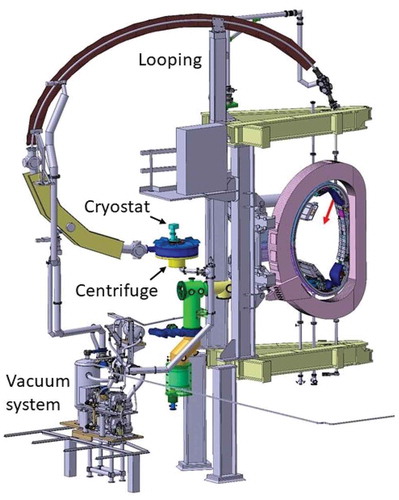
Fig. 2. Example layout of available launching slot concept. The centrifuge runs with 140 Hz, hence every 7 ms a possible slot occurs. In case an available slot is occupied by launching a pellet, the next slot will be available when the minimum cycle time of 12 ms has elapsed. In this example, at least one time slot must be left free. After the fifth launched pellet, the particle flux demand decreases in this example, hence some possible slots are not used
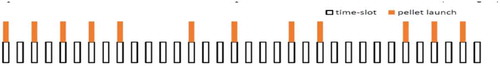
Fig. 3. Setup at ASDEX Upgrade: The pellet source defines the pellet mass mp and the launcher the maximum pellet repetition rate fp. The PLC calculates the maximum particle flux: ГP = mP × fP,max. The DCS requests a fraction of this maximum particle flux (0% to 100%)
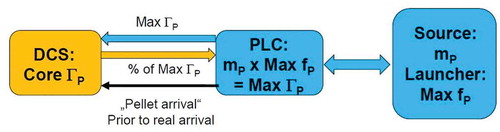
Fig. 4. Block diagram of the Sigma-Delta modulator algorithm. Each gate sync event loads one actual set point value into the integrator. This value is compared with the threshold, which is equal to 100 times the metric value m. Each pellet launch is fed back to the entrance of the integrator, which subtracts the threshold value from it
Fig. 5. (a) Example illustrating the integrator value during a ramp up of set point. (b) The continuously increasing ramp is transformed into a step function, keeping the value from one gate sync to the next one. (c) This value is added to the integrator value. With the integrator value passing the threshold, a pellet launch is initiated and the threshold value (here: 200) is subtracted from the integrator value
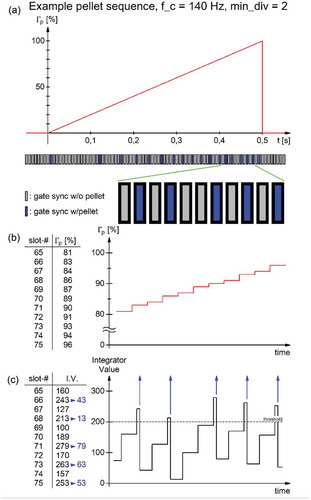
Fig. 6. Application of a smooth rate ramp during a pellet train injected into a plasma discharge. The gradual increase of pellet particle flux creates an increasingly peaked density profile at a density level far beyond the Greenwald density. Increasing density alters the ELM behavior and enforces higher radiative losses. Only a mild reduction of the energy confinement is observed until strong mode activity sets in. At about 3.35 s, a short transient impurity event takes place. For DCS request and pellet system answer,
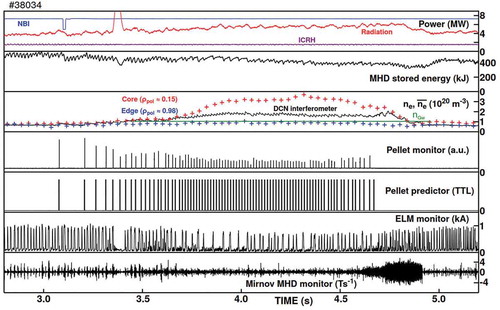
Fig. 7. Plasma discharge in feedforward mode applying a set point ramp (red). Indicated are the pellet repetition rate and the averaged value. All time points are connected to pellet arrival at the plasma, hence the set point ramp is shifted by the pellet flight time. The possible pellet repetition rates are indicated as horizontal lines. The average pellet repetition rate follows well the set point ramp. DCS requests above 70 Hz are ignored, and the system operates at the maximum repetition rate. At 4.7 s, the system runs out of pellets