Figures & data
TABLE I Summary of Specifications for All Three µRA Systems
Fig. 1. Background spectra of all three µRA systems. The spectra displayed represent an averaged signal from approximately 5 days of measurement with 1 spectrum/min showing mainly the fluorescence signal of the optical path and reflections and fluorescence inside the sample volume. The position of relevant hydrogen isotope Raman signals is indicated.
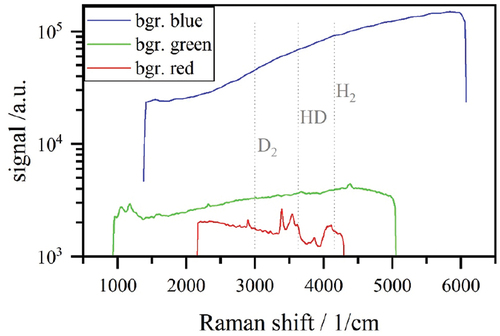
Fig. 2. Response of each µRA system (red, green, and blue) to a varying D2 pressure in the sample volume. Background is subtracted for better visibility of the Raman signal.
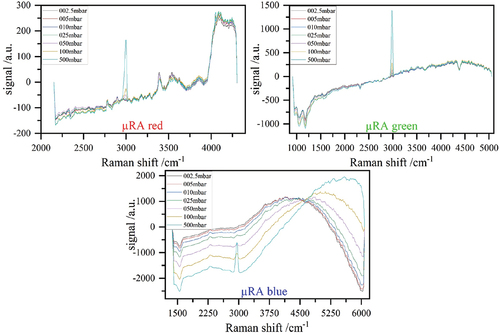
Fig. 3. SNR of all three µRA systems as a function of pressure showing a good linear response for all systems.
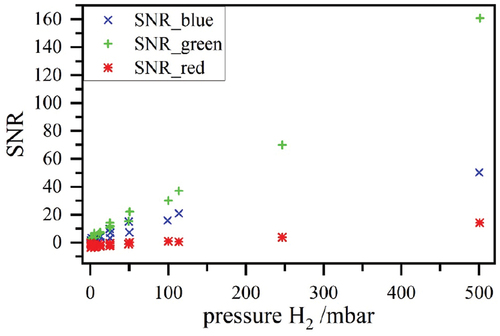
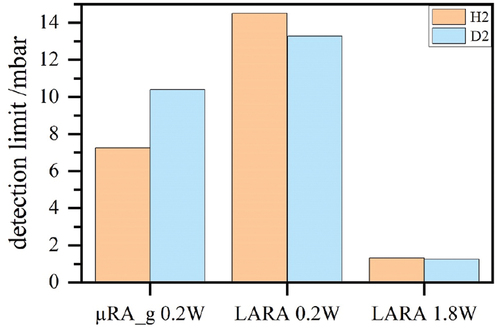
Fig. 4. LoD derived for a SNR ≥ 3 for all three µRA systems. For µRA-red, the structure in the background signal () limits the LoD, especially for H2.
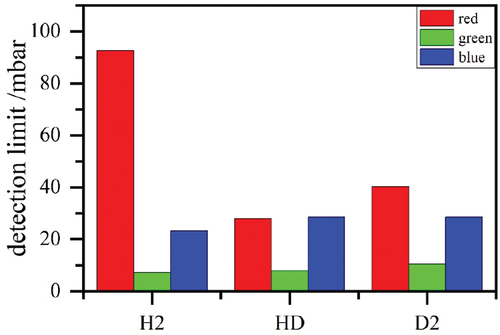
Fig. 5. Comparison of µRA-green with the the LARA system.