2,993
Views
6
CrossRef citations to date
0
Altmetric
Articles

Warburg effect—damping of electromagnetic oscillations

, &
Pages 270-278 | Received 09 Nov 2016, Accepted 02 May 2017, Published online: 02 Jun 2017

Figures & data

Figure 1. Thickness of the ordered water layer (exclusion zone) above a plane charged surface as a function of pH. Positively and negatively charged particles denoted by plus and minus signs are excluded from the ordered water layer for pH < pH0 and pH > pH0, respectively. Vertical arrows denote orientations of the intensity of the electric field in the ordered water layer excluding charged particles. The intermediate value pH0 denotes a point on the pH axis where ordered water layer is not formed. The change of the charge in the surface layer should result in a change of the potential barrier ΔΨ in the water and shift of the pH0 along the pH axis. Horizontal arrows denote possible shifts of the pH0 point.
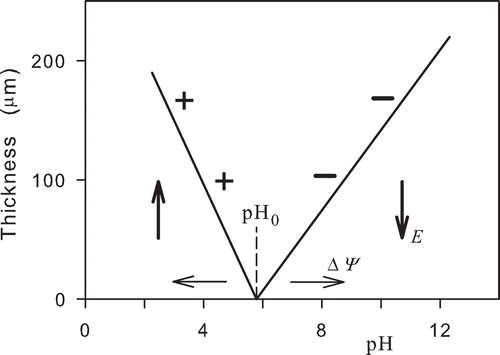
Figure 1. Thickness of the ordered water layer (exclusion zone) above a plane charged surface as a function of pH. Positively and negatively charged particles denoted by plus and minus signs are excluded from the ordered water layer for pH < pH0 and pH > pH0, respectively. Vertical arrows denote orientations of the intensity of the electric field in the ordered water layer excluding charged particles. The intermediate value pH0 denotes a point on the pH axis where ordered water layer is not formed. The change of the charge in the surface layer should result in a change of the potential barrier ΔΨ in the water and shift of the pH0 along the pH axis. Horizontal arrows denote possible shifts of the pH0 point.

Figure 2. Model assessment of the thickness of the ordered water layer as a function of pH at the membrane of a healthy functional (H) and dysfunctional (Ca) mitochondrion. The dashed lines and the dotted lines represent the thickness of the ordered water layer of the functional and dysfunctional mitochondrion, respectively. ΔpH denotes decrease of the number of transferred hydrogen ions from the matrix space to cytoplasm in a dysfunctional mitochondrion. The thicknesses of the ordered water layers are related to the absolute values of electric potentials.
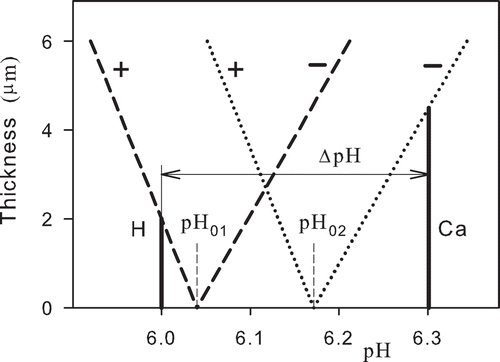
Figure 2. Model assessment of the thickness of the ordered water layer as a function of pH at the membrane of a healthy functional (H) and dysfunctional (Ca) mitochondrion. The dashed lines and the dotted lines represent the thickness of the ordered water layer of the functional and dysfunctional mitochondrion, respectively. ΔpH denotes decrease of the number of transferred hydrogen ions from the matrix space to cytoplasm in a dysfunctional mitochondrion. The thicknesses of the ordered water layers are related to the absolute values of electric potentials.

Figure 3. Potential at the inner mitochondrial membrane for functional (Healthy) and dysfunctional (Cancer) mitochondria. A—apparent potential, R—actual potential corresponding to the transfer of hydrogen ions across the inner membrane, T—combination of the actual potential and the potential across the ordered water layer (dark grey and black columns). The arrows denote orientations of the intensity of the electric field.
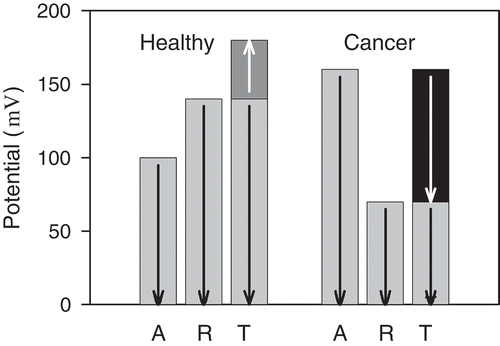
Figure 3. Potential at the inner mitochondrial membrane for functional (Healthy) and dysfunctional (Cancer) mitochondria. A—apparent potential, R—actual potential corresponding to the transfer of hydrogen ions across the inner membrane, T—combination of the actual potential and the potential across the ordered water layer (dark grey and black columns). The arrows denote orientations of the intensity of the electric field.