Figures & data
Figure 1. Flow chart. Simplified sketch of the performed protocol. HDF-cells are cultivated in 25 cm2 flask; upon confluence transfer into six 6-multiwell plates (working volume: 1.90–2.90 mL, surface/well: 9.6 cm2); exposure of three plates to the uwf-EM signal (for 10 min, distance: approx. 5 mm from the log-antenna); incubation of all six plates in different compartments of the incubator for up to 96 hours; execution of PCR (determination of HDF-viability and genetic expression of IL-6, TNFa, MMP-1, collagen and elastin) followed by a repetition of the 10 min uwf-EM treatment cycle on exposed cells every 24 hours. Note: the HDF-well in this plate was used as for monitoring purposes only. The HDF-well in this plate was used as for monitoring purposes only.
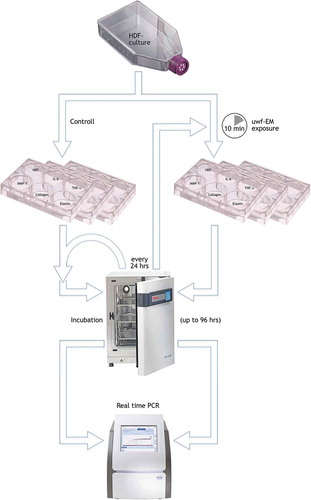
Table 1. Sense and antisense primers as obtained by real-time PCR.
Table 2. Two sided t- and p-values of t-test statistics. In accordance with the figures below, the diverging trends of controls and uwf-EMF-exposed cultures with a significance level of p < α (0.05) yields a non-significant difference in HDF data. However, H0 is rejected in the cases of IL-6, TNF-α and MM-1 (shaded areas); this is in line with tcrit being ≥2.777 among all data sets; this is further supported by tstat > tcrit leading also to the rejection of H0.
Figure 2. Cell viability measurement. HDF viability after treatment with and without uwf-EM exposure.
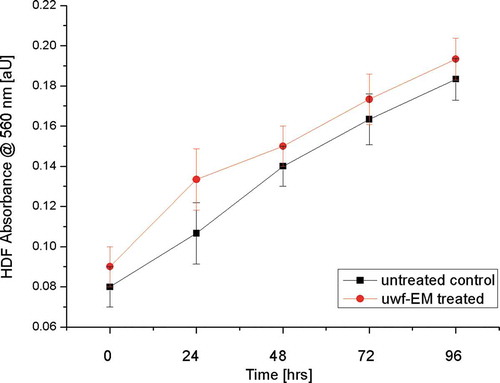
Figure 3. Real-time PCR analysis using specific primers for cytokines. Relative IL-6 gene expression from HDF (left) as well as TNF-α gene expression from HDF (right), treated with and without uwf-EM signals.
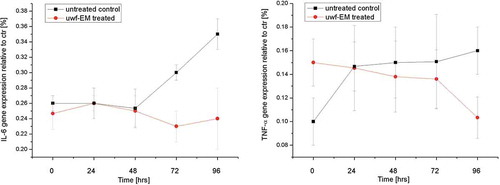
Figure 4. Real-time PCR analysis using specific primers for MMP-1, collagen type-I and elastin. Relative MMP-1 expression from HDF (top left), relative collagen type-1 gene expression from HDF (top right) and relative elastin gene expression from HDF (bottom), treated with and without uwf-EM signals.
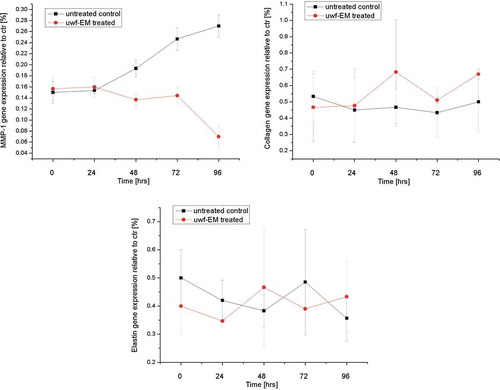
Figure 5. Generic setup of the FRACTOS device with cell culture.
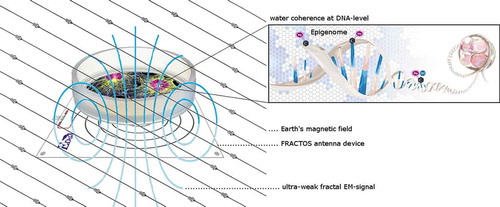
Table 3. Magnetic flux densities of background and FRACTOS logarithmic antenna in three repeats. Background values denote signal strength with full set-up yet at min. signal intensity, whereas 100% measurements denote maximum intensity of the emitted signal originating from the log-antenna.
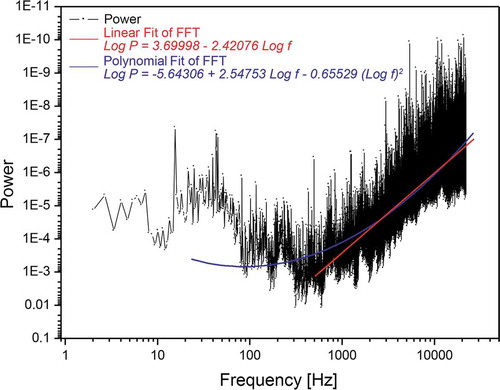
Figure 6. Linear regime (red segment of fitting) between power logarithm and frequency logarithm in the frequency window of 0.5 - 20 kHz of the used audio signal (whiteHBfractal.wav). The polynomial fit includes also the sub-500 Hz regime down to 20 Hz (see text for details).