Figures & data
Figure 1. Proliferative response to CRET stimulation. Trypan blue quantification of cell number in samples intermittently exposed (5 min On/4 hours Off) or sham-exposed for 48 h. Both CRET signals, non-modulated (Non-Mod) and modulated (Mod) significantly increased cell proliferation. Each bar represents the mean ± SEM of 5 independent replicates, with 4 CRET-exposed dishes and 4 sham-exposed controls per replicate. The data are normalized over the respective controls (dotted line 100%). *: 0.01 ≤ p < 0.05; **: 0.001 ≤ p < 0.01; ***: p < 0.001; Student’s t-test
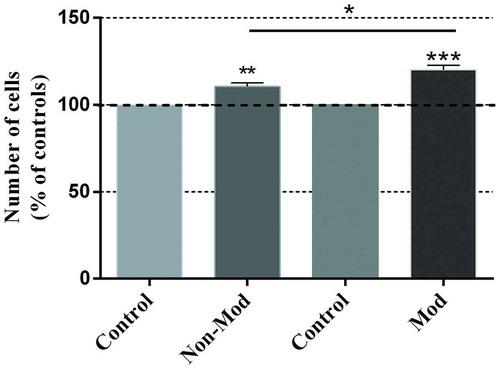
Figure 2. Western blotting of PCNA expression. (a) Analysis of the response to 24 or 48 hours of CRET stimulation from day 4th after plating. Data are normalized over the corresponding sham-exposed controls and expressed as the means ± SEM of 9 independent replicates with the Non-Mod signal (N = 4 at 24 h and N = 5 at 48 h) and 10 replicates with the Mod signal (N = 5 at 24 h and N = 5 at 48 h). *: 0.01 ≤ p < 0.05, Student’s t-test. (b). Densitometry of PCNA protein: representative blots; 60 μg protein per lane. For quantitative analysis, the density of each band was normalized over that of the GAPDH protein
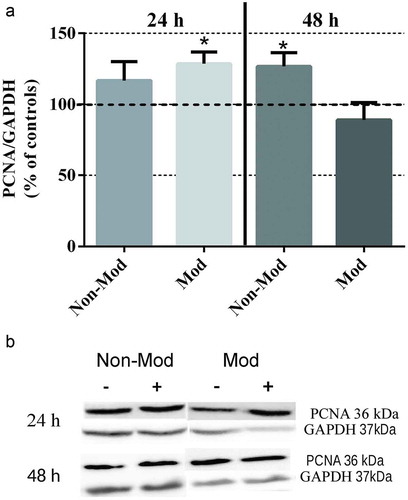
Figure 3. Western blot analysis and photomicrographs of Hsp47 and Hsp27 expression after 4:10-hour treatment. Means ± SEM of protein expression in samples exposed to Non-Mod or Mod CRET signals, normalized over the respective sham-exposed controls, and the corresponding representative blots (60 μg protein per lane) from the densitometric assays. For quantitative analysis, the density value of each band was normalized over that of the GAPDH protein. (a) Hsp47 expression; 5 or 6 repeats per experimental group. (b) Densitometry for Hsp47, representative blots. (c) Hsp27 expression; 6 repeats per experimental group. (d) Densitometry for Hsp27 protein, representative blots. NS. Not significant statistically. **: 0.001 ≤ p < 0.01, Student’s t-test. (e) Immunofluorescent staining for Hsp47 (red) and Hsp27 (green) intracellular location in CRET- and sham-exposed samples: representative micrographs in which the cell nuclei (blue) were Hoechst counterstained; original magnification: x400. While in sham-exposed samples, Hsp47 and Hsp27 formed small granular particles evenly distributed throughout the cytoplasm, increased and dense Hsp47 and Hsp27 immunostainings was found in the cytoplasm of CRET-exposed cells. Besides, although no obvious differences with respect to controls were detected in the Hsp47 immunostaining pattern of CRET-exposed samples, in many of these RF-stimulated cells, the Hsp47 labeling also concentrated along the distal end of their cytoplasmic prolongations
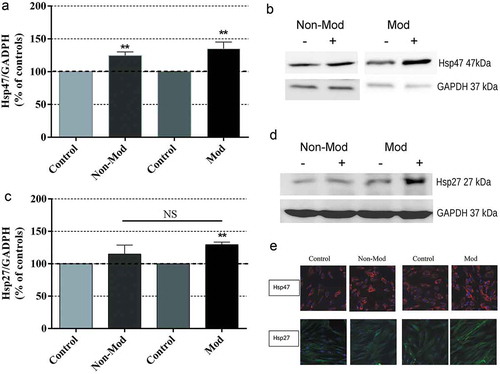
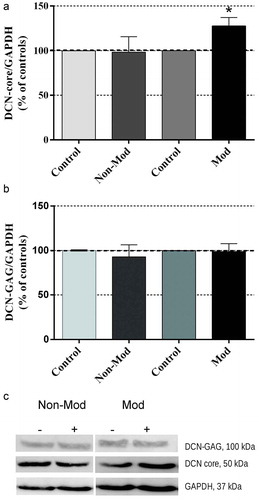
Figure 4. Western blotting of decorin (DCN) expression after 24-hour exposure to Non-Mod or Mod CRET signals. (a) Expression of DCN core (DCN-core/GAPDH ratio) (b) Expression of mature decorin (DCN-GAG/GAPDH ratio). Data are means ± SEM of 6 repeats per experimental group, normalized over the respective sham-exposed controls. *: 0.01 ≤ p < 0.05, Student’s t-test. (c). Densitometry of the two DCN proteins (60 μg protein per lane): representative blots. For quantitative analysis, the density value of each band was normalized over that of the GAPDH protein