Figures & data
Figure 1. XTT assay. Cell proliferation after 48 h of intermittent CRET exposure at current densities of 50 or 100 µA/mm2. Data are means ± SEM normalized over the corresponding sham-exposed controls represented by the reference line 100%. Between 3 and 7 experimental replicates per cell type. *: 0.05 > p ≥ 0.01; **: 0.01 > p ≥ 0.001; Student´s t-test
Figure 2. Wound Assay. A. Representative micrographs of the wound at t = 0 h, 6 h or 12 h from CRET- or sham-stimulation (Control) onset. Bars: 50 µm. The dotted white lines indicate the wound’s edges. B. Computational quantification of the gap closure calculated as the mean distance (µm) between the edges in three equidistant points of the gap, using Photoshop software. C. Quantification of the area (µm2) between the wound edges using ISAM software. Data de are means ± SD, normalized over the corresponding controls, represented by the reference line 100%, of six experimental replicates per cell type and time interval. *: 0.05 > p ≥ 0.01; Student´s t-test
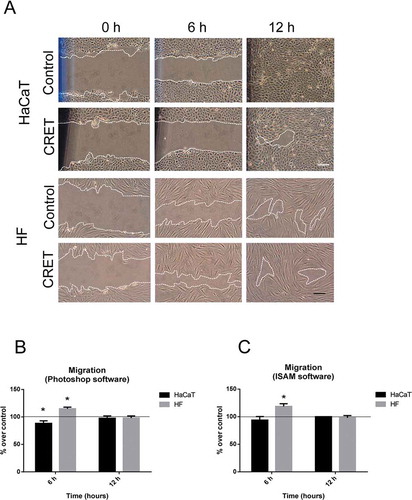
Figure 3. Immunoblot for protein expression. A. Representative blots at 6 h or 12 h of CRET or sham treatment (100 µg protein/lane). β-actin or GAPDH were used as loading control. Cn: Control. T: CRET treatment. B. Densitometry values for protein expression at 6 h or 12 h of CRET or sham treatment in keratinocytes HaCaT. C. Densitometry for protein expression at 6 h or 12 h of CRET or sham treatment in fibroblasts (HF). Data, normalized over the corresponding sham-exposed controls represented by the reference line 100%, are means ± SD of the protein/β-actin or protein/GAPDH ratios of at least 5 experimental repeats per protein and time interval. *: 0.05 > p ≥ 0.01; **: 0.01 > p ≥ 0.001; Student´s t-test
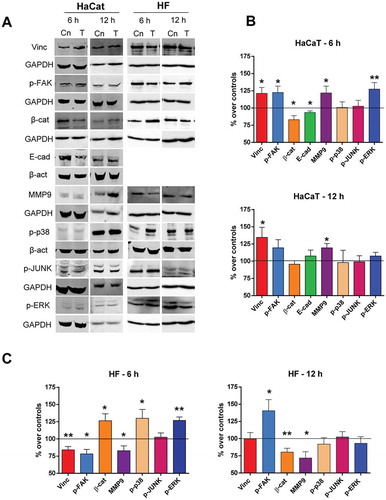
Figure 4. Immunofluorescence expression of Vinculin and p-FAK in keratinocytes. Monolayers (side columns) at 6 and 12 hours of CRET or sham treatment (Control), and in wound edges (central column) at 6 hours only. Representative merged micrographs. Red: vinculin or p-FAK labeling. Blue: nuclei. Bar: 20 µm. Brightness and contrast adjustments were applied to the whole of each image using Photoshop software. The adjustments in the micrographs of the treated samples were the same as those in the images of their controls. The arrows highlight presence of vinculin labeling on the membrane of 6-hour control cells located at the migration front, and that of p-FAK in the nuclei of 12-hour exposed cells
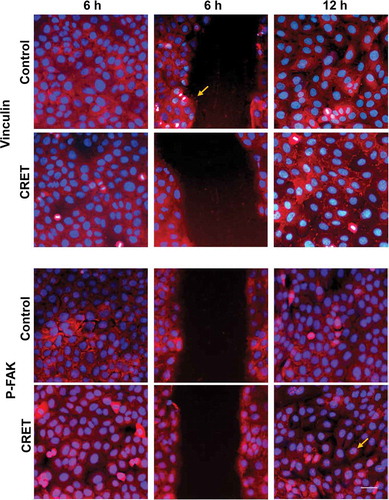
Figure 5. Immunofluorescence expression of Vinculin, p-FAK and β-catenin in fibroblasts. Monolayers at 6 or 12 hours of CRET or sham treatment (Control). Representative merged micrographs. Red: β-catenin, vinculin or p-FAK labeling. Blue: cell nuclei. Bar: 20 µm. Brightness and contrast adjustments were applied to the whole of each image using Photoshop software. The adjustments in the micrographs of the treated samples were the same as those in the images of their controls. Arrows show vinculin plaques and p-FAK and β-catenin labeling on the plasma membrane
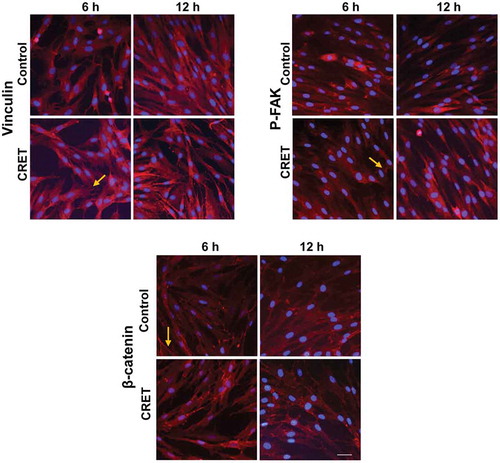
Figure 6. Immunofluorescence expression of β-catenin and E-cadherin in keratinocytes. Monolayers (side columns) at 6 h or 12 h of CRET or sham treatment (Control), and on the gap edges (central column) at 6 h. Representative merged images. Red: β-catenin and E-cadherin labeling. Blue: nuclei. Bar: 20 µm. Brightness and contrast adjustments were applied to the whole of each image using Photoshop software. The adjustments in the micrographs of the treated samples were identical to those in their controls. Arrows show dotted labeling of E-Cadherin at perinuclear locations
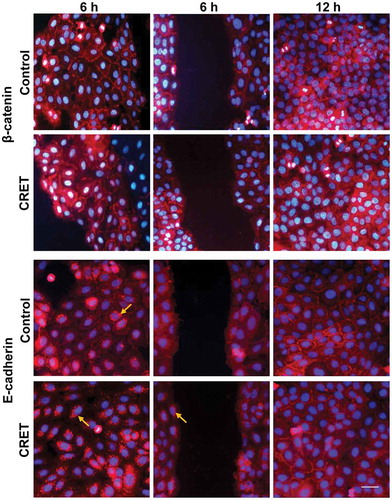
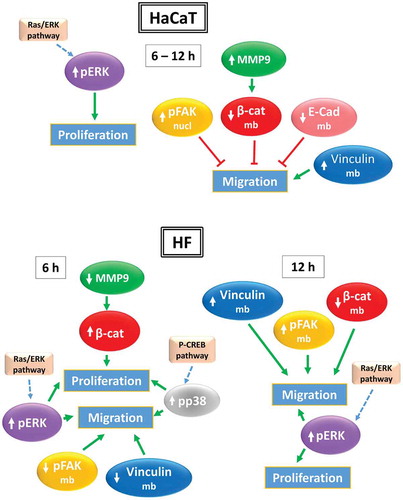
Figure 7. Protein translocation in keratinocytes (HaCaT) and fibroblasts (HF). Schematic representation of CRET-induced changes in the location of proteins involved in cell migration after 6 or 12 hours of treatment. See Discussion for detailed explanation
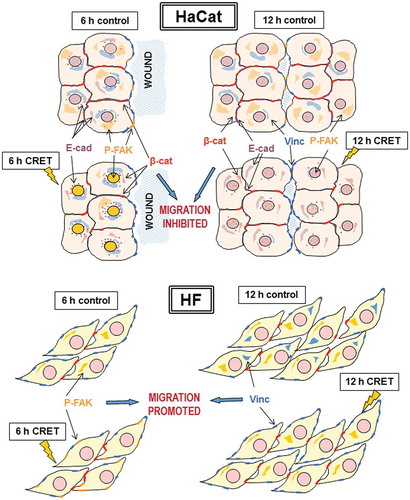
Figure 8. Protein expression in keratinocytes (HaCaT) and fibroblasts (HF). Schematic representation of CRET-induced changes in the expression of proteins involved in cell proliferation and migration after 6 or 12 hours of treatment.↑: protein overexpression; ↓: decreased expression. Green arrows: promotion. Red lines: inhibition. Dotted blue arrows: proposed pathways. See Discussion for detailed explanation