Figures & data
Figure 1. Animal positioning for extremely low-frequency electromagnetic irradiation (a): 1 – apparatus; 2 – rat position. Intratumoral temperature measurements (b): 3 – fiber-optic sensor, 4 – thermometer
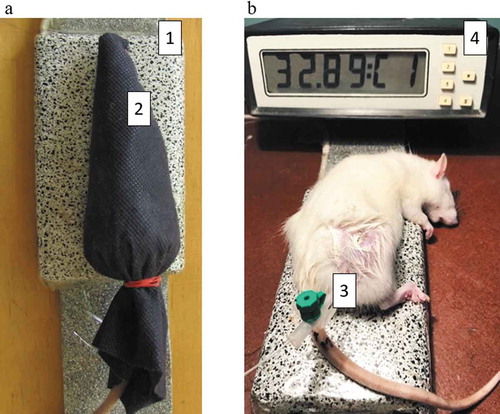
Figure 2. Distribution of electromagnetic fields on the apparatus surface: (a) electric field; (b) magnetic field
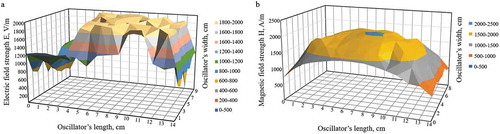
Table 1. Walker-256 carcinosarcoma growth on day 15 after implantation (M ± m)
Figure 3. The growth kinetics of Walker-256 carcinosarcoma (M ± m): 1 – no treatment; 2 – DOX; 3 – DOX + EMF; 4 – EMF
Figure 4. Changes in body weight of control and Walker-256 carcinosarcoma-bearing rats relative to day 3 after tumor implantation: a – control; b – no treatment tumor; c – DOX; d – DOX + EMF; e – EMF
Figure 5. Overall survival of Walker-256 carcinosarcoma-bearing rats 20 days after tumor implantation: 1 – no treatment; 2 – DOX; 3 – DOX + EMF; 4 – EMF
Table 2. Tumor growth on 15th day after Walker-256 carcinosarcoma implantation (M ± m)
Figure 6. Histological findings in Walker-256 carcinosarcoma. H&E stain. (a) no-treatment group: sarcomatous (sc), carcinomatous (cc) components, fibrotic tissue (f) and interstitial edema (arrow), magnification x100; (b) DOX treatment: sarcomatous (sc), epithelioid (ec) components, fibrotic tissue (f) and necrosis of tumor cells (n), magnification x200; (c) DOX + EMF treatment: necrosis (n) and apoptosis (a) of tumor cells with extracellular matrix (m), magnification x400; (d) EMF: apoptosis of tumor cells (a) and pseudo-granular structures (arrows) magnification x400
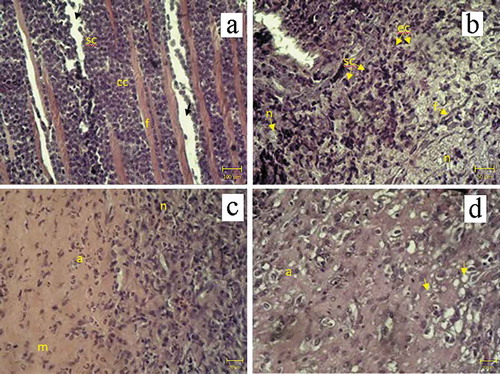
Table 3. Histological findings in the liver of Walker-256 carcinosarcoma-bearing rats
Figure 7. Histological findings in the liver of Walker-256 carcinosarcoma-bearing animals. H&E stain. (a) no treatment; (b) DOX; (c) DOX + EMF; (d) EMF: neutrophil infiltration (ni), hepatocytes with empty nuclei (Eh), hepatocyte hypertrophy (h), ground-glass hepatocytes (gh), biliary hyperplasia (e), magnification x400
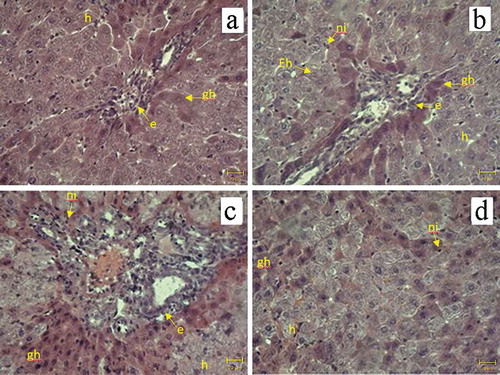
Figure 8. Hepatic antioxidant parameters: (a) TBARS, (b) SOD, (c) CAT, (d) GSH in 1 – control, 2 – no treatment, 3 – DOX, 4 – DOX + EMF, 5 – EMF groups.&Statistically significant difference from control (no tumor), p < .05;*Statistically significant difference from no-treatment, p < .05;+Statistically significant difference from DOX, p < .05
Figure 9. Serum alanine aminotransferase (ALT) and aspartate aminotransferase (AST) activities: control group with no tumor (1), Walker-256 carcinosarcoma-bearing animals receiving no treatment (2), DOX (3), DOX + EMF (4), EMF (5).&Statistically significant difference from control without tumor, p < .05;*Statistically significant difference from control no-treatment with the tumor, p < .05,+Statistically significant difference from tumor rats treated with conventional DOX, p < .05