Figures & data
Table 1. Characteristics of study participants
Table 2. Overview of reported symptoms between exposed and control group on the Likert scale
Table 3. Relationship between predictors and subjective symptoms using logistic regression
Table 4. Relationship between predictors and subjective symptoms using linear regression
Table 5. Reporting of subjective symptoms based on the presence in zone IV
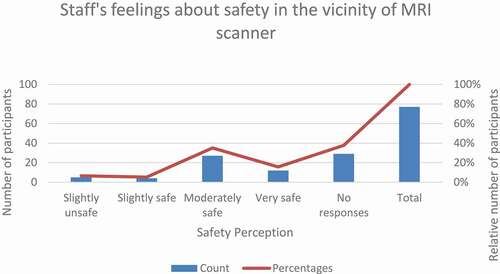
Figure 1. Perceptions of MRI scanner safety among MRI staff.