Figures & data
TABLE 1 Research Domain Criteria Units of Analysis Framework: Modification for Use in Research with Youth
FIGURE 1 Graphical representation of the research concepts that comprise the Operations Triad Model. The top half (a) represents Converging Operations: a set of measurement conditions for interpreting patterns of findings based on the consistency within which findings yield similar conclusions. The bottom half denotes two circumstances within which researchers identify discrepancies across empirical findings derived from multiple informants’ reports and thus discrepancies in the research conclusions drawn from these reports. On the left (b) is a graphical representation of Diverging Operations: a set of measurement conditions for interpreting patterns of inconsistent findings based on hypotheses about variations in the behavior(s) assessed. The solid lines linking informants’ reports, empirical findings derived from these reports, and conclusions based on empirical findings denote the systematic relations among these three study components. Further, the presence of dual arrowheads in the figure representing Diverging Operations conveys the idea that one ties meaning to the discrepancies among empirical findings and research conclusions and thus how one interprets informants’ reports to vary as a function of variation in the behaviors being assessed. Lastly, on the right (c) is a graphical representation of Compensating Operations: a set of measurement conditions for interpreting patterns of inconsistent findings based on methodological features of the study’s measures or informants. The dashed lines denote the lack of systematic relations among informants’ reports, empirical findings, and research conclusions. Originally published in De Los Reyes et al. (Citation2013). © Annual Review Of Clinical Psychology. Copyright 2012 annual reviews. All rights reserved. The annual reviews logo, and other annual reviews products referenced herein are either registered trademarks or trademarks of annual reviews. All other marks are the property of their respective owner and/or licensor.
FIGURE 2 Panel A: Example of use of “mix-and-match” criterion to identify optimal informants to include in a multi–informant assessment. Informants systematically vary in the perspective and context from which they rate youth mental health symptoms, with the goal of effectively triangulating on a Trait score. Panel B: Graphical depiction of multi–informant reports triangulating, much like GPS, to identify the Trait score. Both teacher- and parent-report provide information from an other-perspective, with teachers providing information about the school context and parents providing information about the home context. Youth reports provide the self-perspective and information about both the school and home contexts. Figures adapted from Kraemer et al. (Citation2003).
FIGURE 3 From Makol et al. (Citation2020): Values on dotted lines denote bivariate correlations among parent, adolescent, and unfamiliar peer confederate reports of adolescent social anxiety. Values on solid arrows denote component weights from principal components analysis of parent, adolescent, and unfamiliar peer confederate reports. **p <.01; ***p <.001.
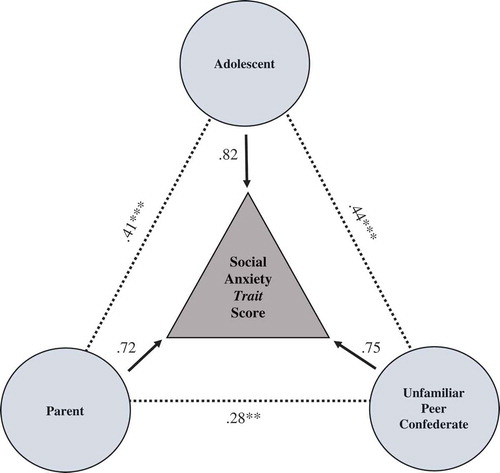
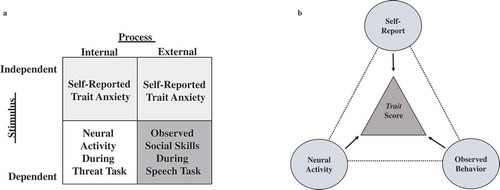
FIGURE 4 Panel A: Example of use of “mix-and-match” criterion to strategically integrate units of analysis in a multi-unit assessment used to index activity relevant to the negative valence RDoC domain. Units systematically vary with regard to whether they assess a process for which activity is directly observable or internally expressed, and whether unit activity depends on a stimulus, with the goal of effectively triangulating on a Trait score of unit activity. Panel B: Graphical depiction of multi-unit activity triangulating, much like GPS, to identify a negative valence Trait score. Both neural activity and observed behavior are units for which their activity requires a stimulus (i.e., threat-based cues), with neural activity indexing internal processes and observed behavior indexing external processes. The self-report of trait anxiety estimates activity independent of direct activation of a state-based stimulus, and processes reflecting trait anxiety manifest internally (e.g., anxious thoughts) and externally (e.g., avoidance, pressured speech). Figures adapted from Kraemer et al. (Citation2003).