
Figures & data
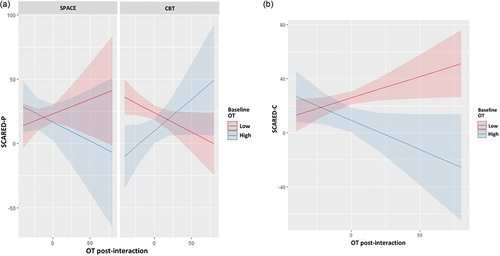
Figure 1. (a) The moderating effect of changes in child OT on the association between baseline child OT and post-treatment SCARED-P, separately for SPACE and CBT; (b) the predicting effect of changes in OT on the association between baseline OT and post-treatment SCARED-C. The figures demonstrate the associations when baseline OT is high and when it is low, based on the 3-way interaction model. The shading represents the confidence intervals (95%).
Supplemental material